Room revenue by room type, by rate plan and by booking source are the same total split three ways. Add up any of the three and you get the same grand total, because they are three answers to one question: where did the room revenue come from. A fourth report, Production by Booking Sources, counts the bookings behind that revenue rather than the revenue itself.
One number, three cuts
All three revenue reports use one screen. A chart of the top twelve rows by revenue sits above a table of every row, and the only difference between them is what the first column holds: a room type, a rate plan or a booking source.
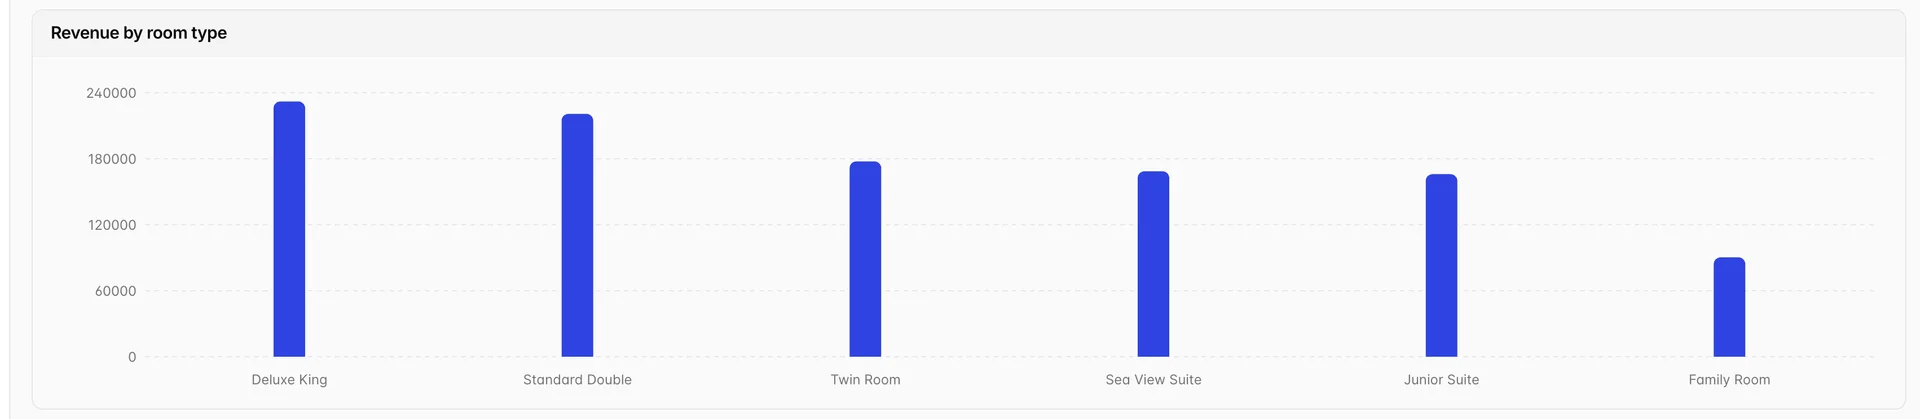
Read the chart for rank and the table for arithmetic. The chart sorts by revenue, so the tallest bar is the biggest earner. The table keeps the order the report came back in, which for room types is the order the property lists them, so the top row is not the top performer.
Reading a row

Two identities hold on every row, and they are the fastest way to check you are reading the report correctly. Room Nights Sold times ADR is that row's Total Revenue, give or take a few dollars, because the rate is shown rounded to the cent and you are multiplying it by several hundred nights. % of Total Revenue is that row's share of the Grand Total beside the section heading. So a row with a high ADR and a small percentage is a room you sell well and rarely; a row with a low ADR and a large percentage is carrying the hotel on volume.
Avg. LOS and No. Reservations are the same fact twice: room nights divided by average length of stay is the reservation count. The pair matters when you are comparing two rows with similar revenue, because thirty long stays and ninety short ones cost the front desk and housekeeping very different amounts of work for the same money.
Cancellation Rate is the share of bookings on that row that were cancelled. It is the column that decides whether a rate plan or a channel is as good as its revenue makes it look: revenue you had to resell twice is worth less than the same revenue booked once.
What each cut is good for
| Report | The decision it supports |
|---|---|
| Room Revenue by Room Type | Pricing and inventory. Compare each type's ADR against its room nights: a type at a high ADR and low nights is priced above the market you are reaching, and a type selling out at a low ADR is priced under it. |
| Room Revenue by Rate Plan | Discounting. This is where you find out whether the non-refundable rate is bringing in business you would not otherwise have, or just discounting business you already had. |
| Room Revenue by Source | Channel mix. Read it next to the commission on each source, which lives on the source profile rather than in this report, because the highest-revenue channel is often not the highest-margin one. |
| Production by Booking Sources | Acquisition. Same channels, but counted in bookings, with lead time and revenue per reservation. |
Date Frame changes the question
The first control in the filter panel is not a date. It is Date Frame, and it decides what the dates below it mean.
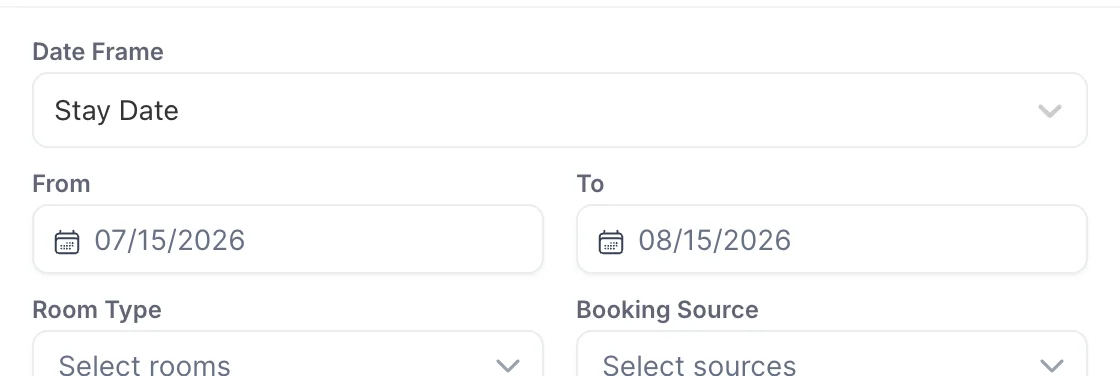
- Stay Date counts the nights that fall inside the range, whenever they were booked. This is the figure that ties to the month you are closing.
- Booking Date counts the bookings made inside the range, whenever the guest stays. This is the figure that tells you whether last week's campaign worked.
The two can disagree by a lot in a month with heavy advance booking, and neither is wrong. Both reports default to Stay Date over the last month, so the figures you see on opening are last month's actual nights.
Production by Booking Sources
Production is the acquisition view of the same channels. Its chart counts reservations rather than revenue, and its table adds two columns the revenue reports do not have: Lead Time (Avg Days), the average gap between the booking and the arrival, and Avg. Revenue per Res.
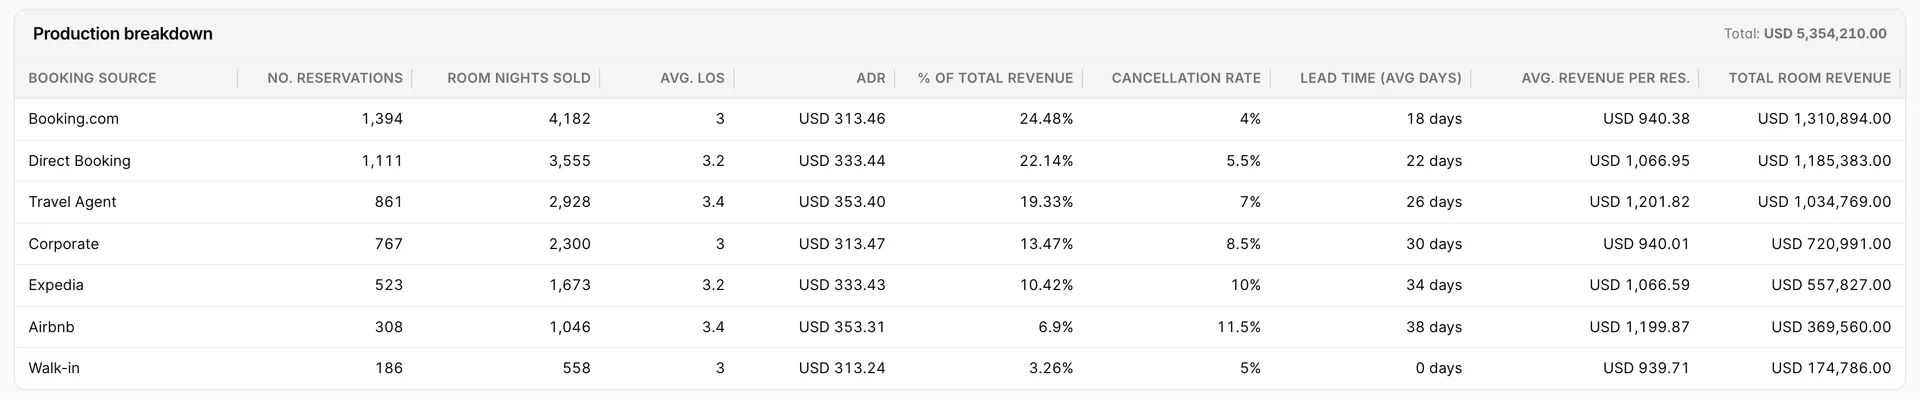
Lead time is the column that changes what you do. A channel booking five weeks out is a channel you can raise rates on early; a channel booking three days out is filling the gaps you have left, and pricing it as though it were the first is how you end up with an empty Tuesday. A walk-in has a lead time of zero by definition, and a row claiming otherwise is a data problem worth reporting.
The filters that change the number
Beyond the dates, four controls change what is counted rather than how it is displayed. All of them sit in the same panel, and the button at the bottom is Save Changes rather than the View Report the daily reports use.
| Control | What changes when you use it |
|---|---|
| Booking Status | Restricts to the reservation states you tick, from Reserved and Confirmed through to Cancelled and No-Show. Leaving it empty includes everything, which means cancelled bookings are in the revenue figure until you exclude them. |
| Include Taxes / Service Charges | Off by default, so the revenue you see is net. Turn it on and every figure grows, including ADR. Two people comparing notes with this set differently will never reconcile. |
| Exclude Complimentary Rooms | Drops zero-rate stays. They add room nights and no revenue, so leaving them in pulls ADR down. On every panel except Room Revenue by Source. |
| Booking Lead Time | On the source panel only, and it adds a column rather than filtering. It is the same lead time Production shows. |
Guest Nationality, Room Type, Rate Plan and Booking Source narrow the population in the obvious way. Narrowing by the same dimension the report groups by is useful more often than it sounds: filtering the room type report to two types gives you a clean comparison of those two with the percentages recalculated against their own total.
What these reports will not do
- There is no export. Not a broken one, as on the daily reports: these four screens carry a Filter Report button and nothing else. Print the page from the browser if you need a copy.
- The table does not sort. No column heading is clickable and there is no sort control in the panel. The chart above the table is the only thing ranked by revenue.
- Commission is not here. A source's revenue is gross of the commission you pay for it. The rate lives on the source type, so a channel at the top of this report can sit lower on margin.
- A Conversion Rate column exists in the source report but cannot be switched on. The view will render it and the panel has no control for it, so you will never see it. Reported, not yet fixed.
- A failed request looks like an empty report. The error goes to the browser console and the page shows No revenue data found. Change the range: a result that does not move is worth reporting.