The Daily Revenue Report is the morning read: how full the property was last night, what it earned, how much of that has actually been paid, and what the next fortnight looks like. Everything on it describes one date, and every money row carries a second column for the month up to that date. Six of the rows open a report of their own.
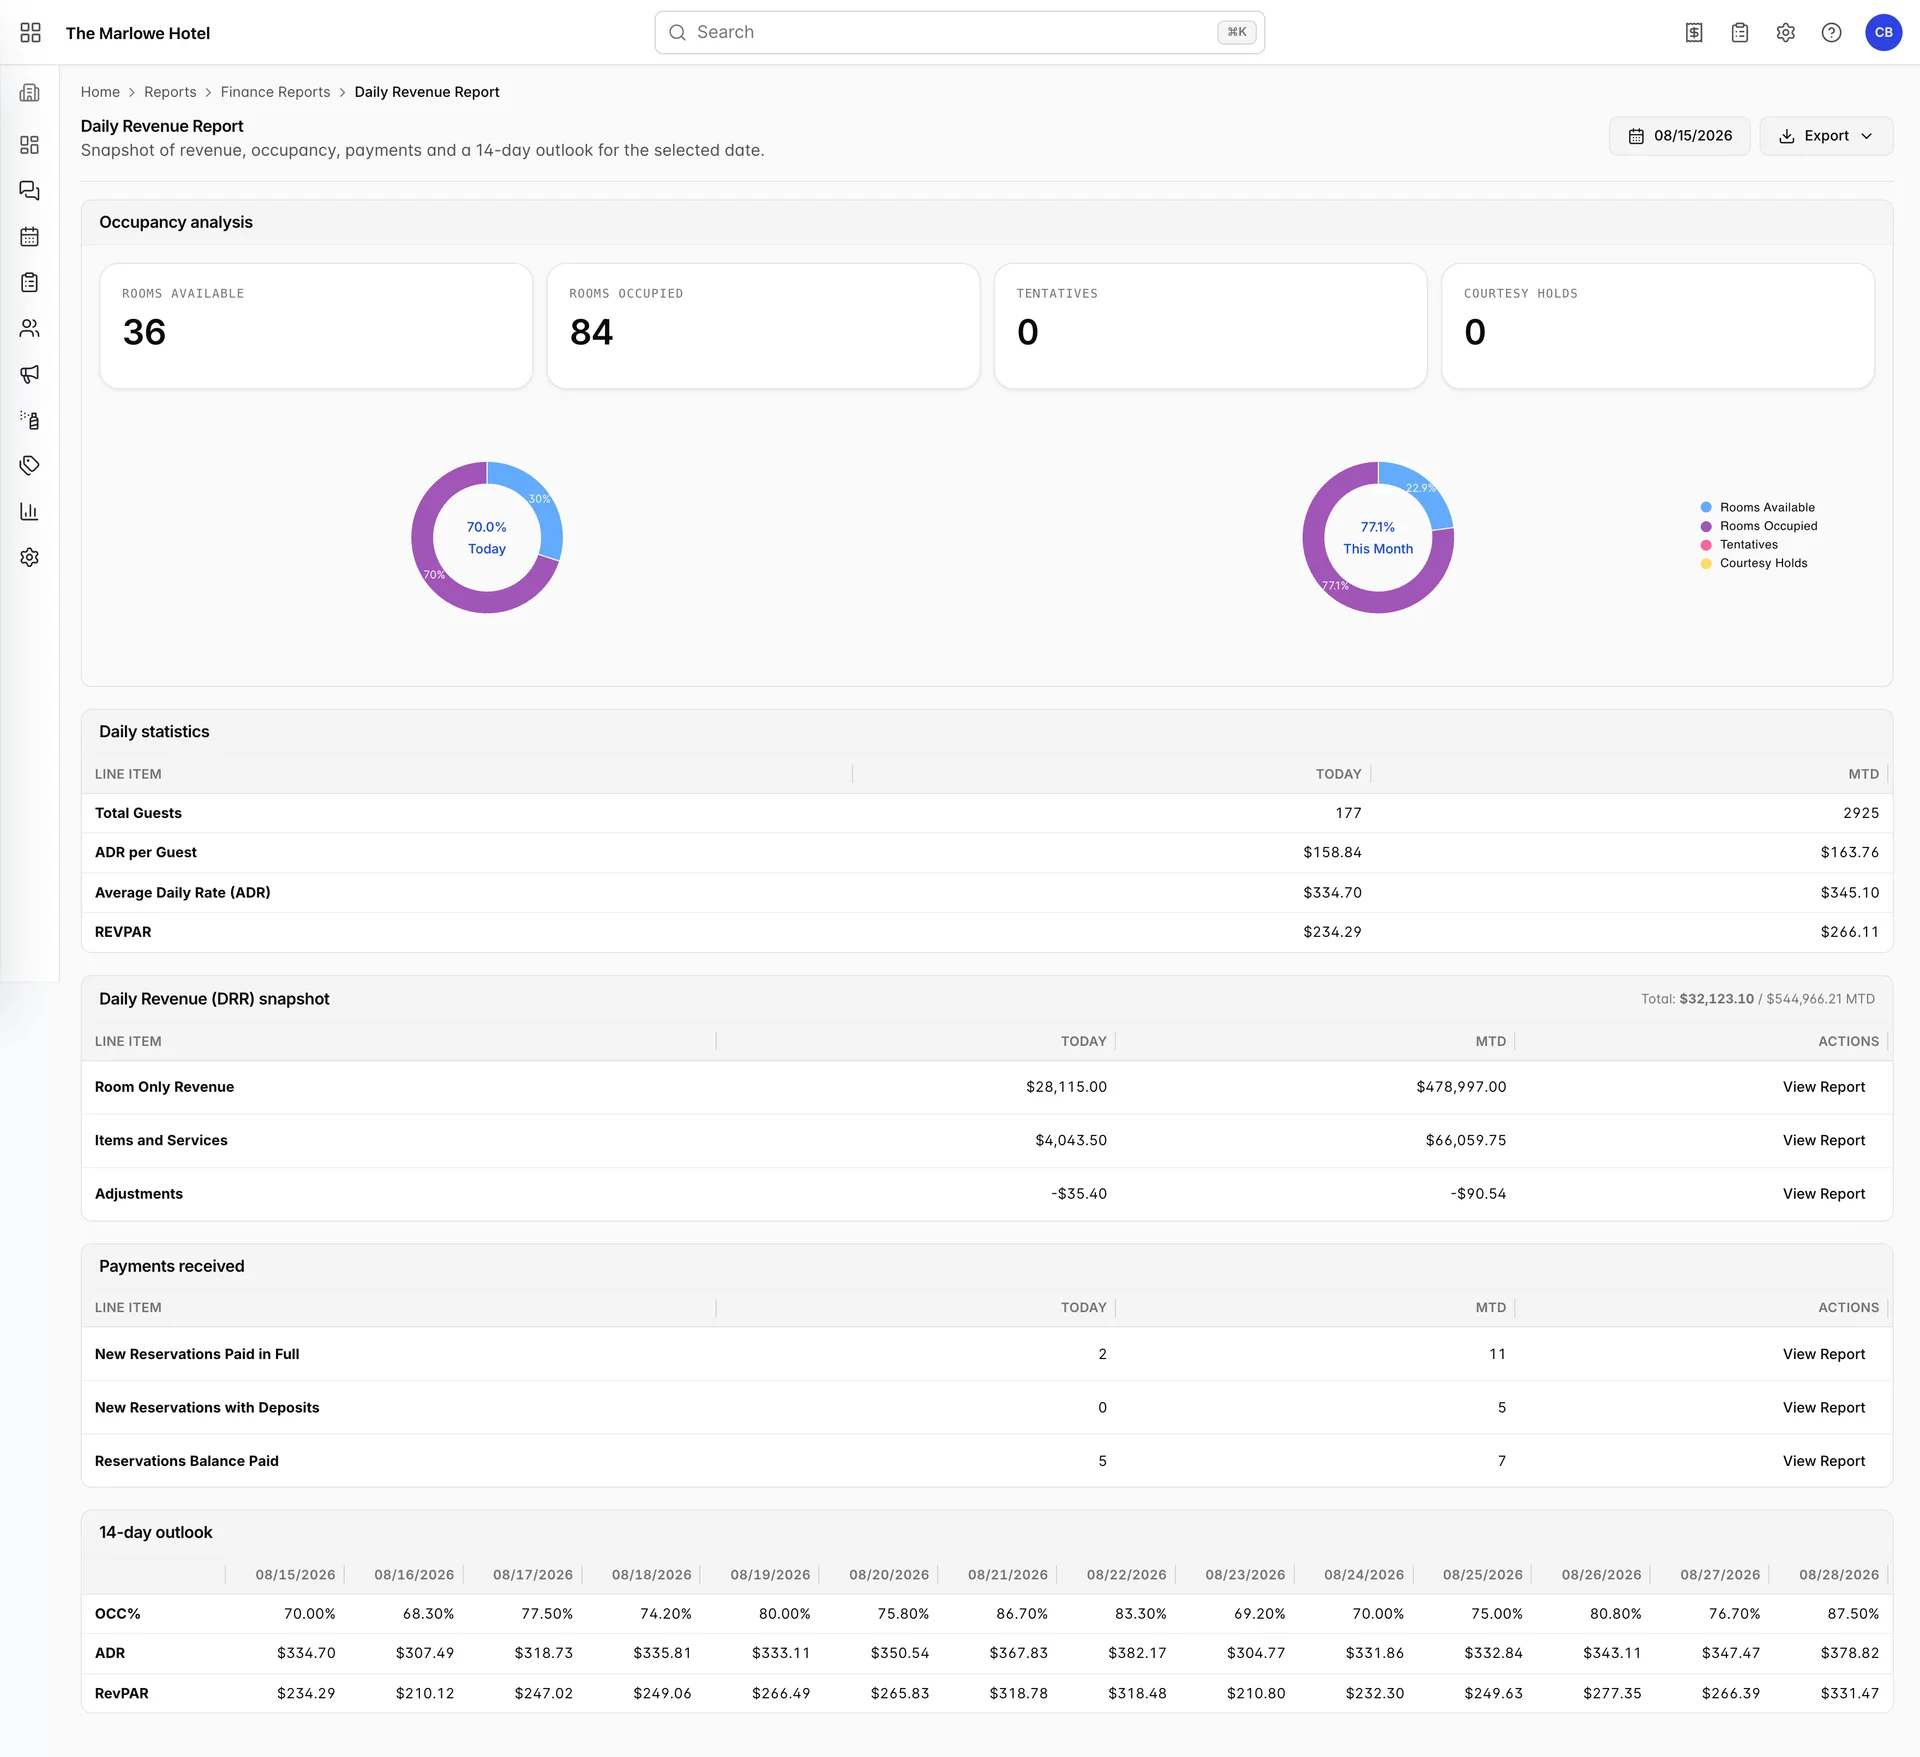
Five sections, one date
| Section | Counts | Opens |
|---|---|---|
| Occupancy analysis | Rooms, on the selected night and across the month so far | Nothing |
| Daily statistics | Guests, and the three rates derived from rooms and revenue | Nothing |
| Daily Revenue (DRR) snapshot | Money, in three lines that sum to the figure in the heading | Room only revenue, items and services, adjustments |
| Payments received | Reservations, not money | Paid in full, with deposits, balance paid |
| 14-day outlook | Occupancy, ADR and RevPAR for the fortnight from the selected date | Nothing |
The date button and what it drives

There is no range and no filter panel on the summary. Click the date button, pick a day, and all five sections reload against it: the TODAY column becomes that day, the MTD column becomes the first of that month up to it, and the outlook starts on it. Pick the 10th and the MTD column covers ten days, not the whole month.
Export offers Export as PDF and Export as Excel. Both send the figures currently on screen and download a file named for the selected date, so an export taken after changing the date matches what you were looking at. Neither includes the six drill-downs; export those from their own toolbars.
Occupancy analysis
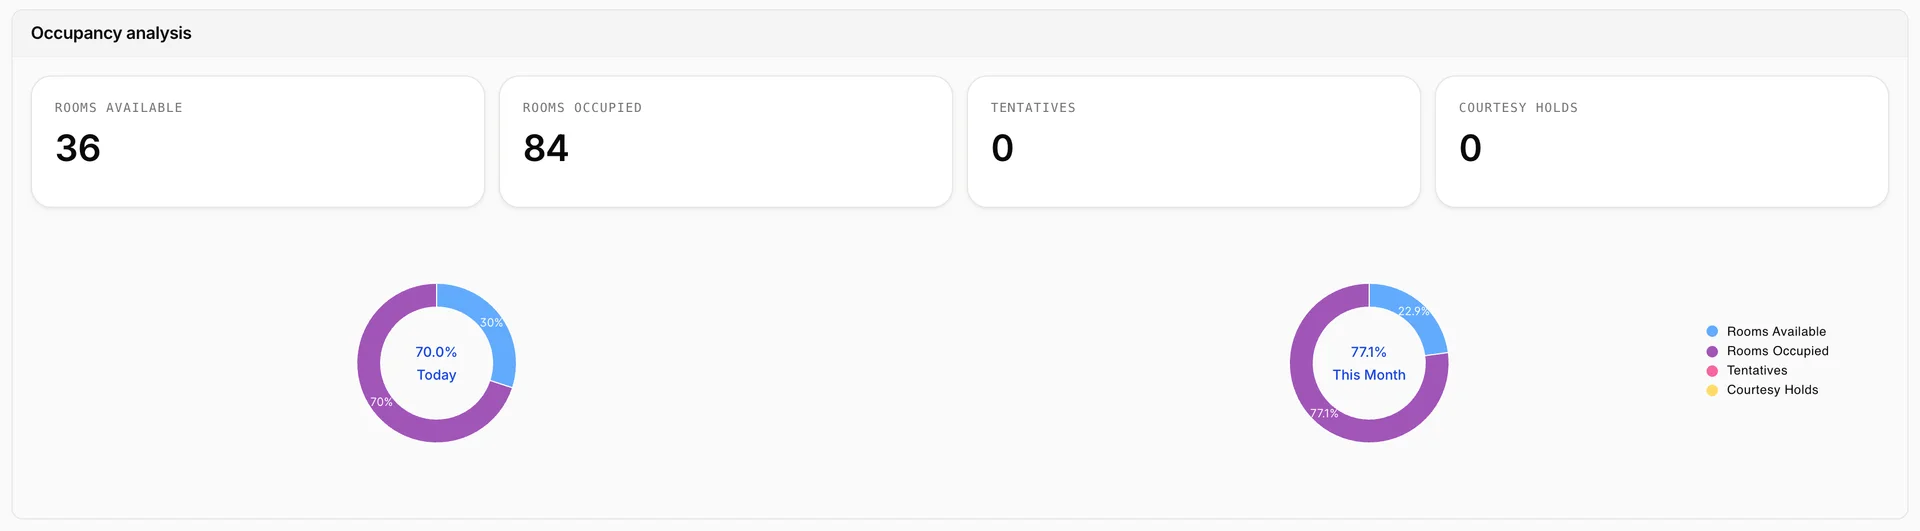
The four tiles count rooms on the selected night. Rooms Available and Rooms Occupied add up to every room the property has, including any that are out of order, so a closed room counts as available here and drags the percentage down. The percentage in the middle of the Today donut is occupied over that total, and it is the same figure the House Status report and the first column of the outlook show for the same night.
Tentatives and Courtesy Holds count rooms held without a confirmed booking: a tentative is an unconfirmed reservation, a courtesy hold is a room taken off sale for a named person for a set number of hours. Both are drawn out of the available slice on the donut rather than added to it, because a held room is a room you cannot sell.
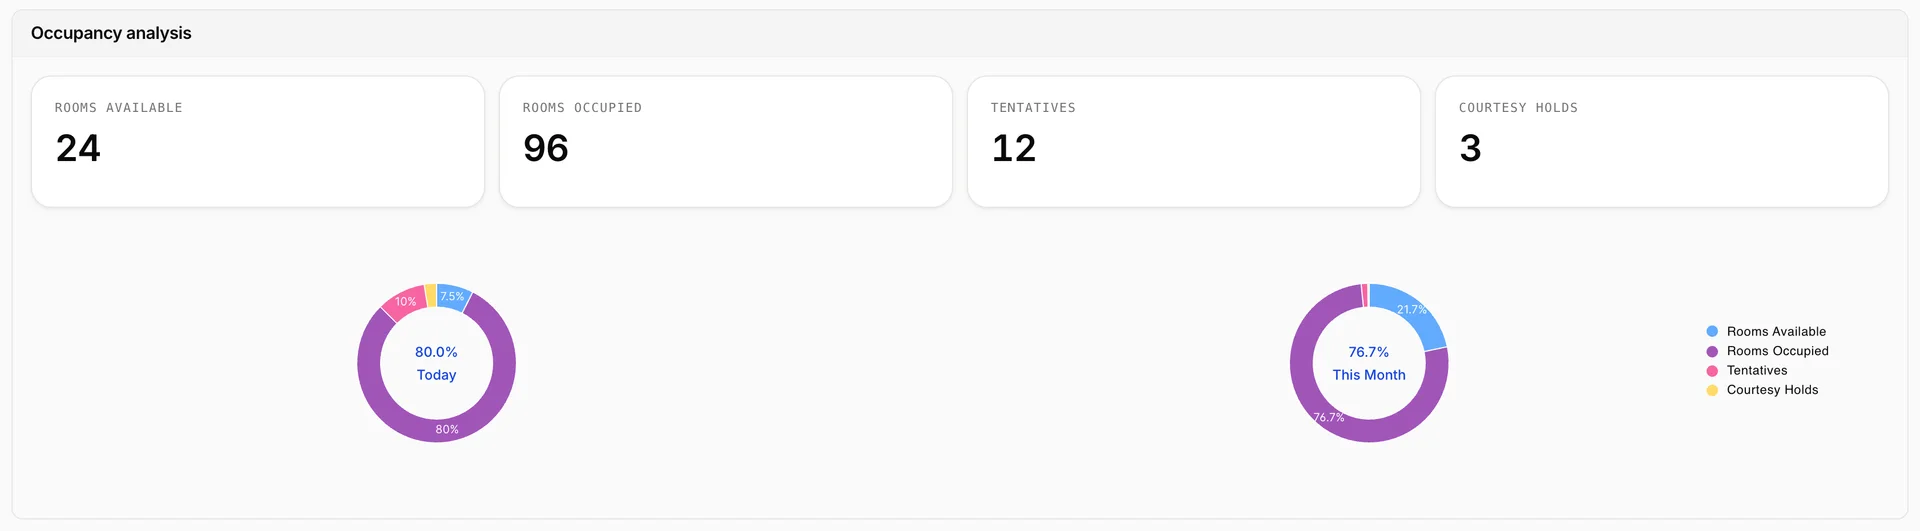
Both tiles read zero on most past dates and that is not a fault. A hold that reaches its own arrival date has already been confirmed, released or walked in, so the numbers only mean something on nights that have not happened yet. Read them together with the available count: 24 rooms left with 15 of them spoken for is a very different night from 24 rooms left and nothing pending.
Daily statistics

All four rows come from two numbers, the rooms sold and the room revenue, so they move together and none of them is an independent measure.
| Row | What it is |
|---|---|
| Total Guests | Heads in house on the night, adults and children together, not reservations |
| ADR per Guest | Room revenue divided by guests. Falls when families arrive, even if the rate did not move |
| Average Daily Rate (ADR) | Room revenue divided by the rooms sold. Says nothing about the empty rooms |
| REVPAR | Room revenue divided by every room in the property, sold or not |
The gap between the last two is the occupancy rate, which is why they are worth reading as a pair. Room revenue only, in all four rows: the restaurant and the spa are in the section below and are not in any of these figures. The same three rates appear in the occupancy, ADR and RevPAR reports, where you can compare them across a range rather than a single night.
The revenue snapshot and its three reports

Rooms, extras and corrections. The total beside the heading is the three rows added together for the selected date, then for the month to date, and adjustments are usually negative, so the total is lower than rooms plus items.
Room Only Revenue

One row per accommodation type. Room Sold counts stays, Room Nights counts nights, and the difference between them is the average length of stay for that type. Avg. Daily Rate (ADR) is Gross Room Revenue over Room Nights, which makes it comparable between a suite sold for two nights and a double sold for seven.
Complimentary Room and House Use count rooms given away and rooms taken by the property itself. They earn nothing, so a type with several of them shows an ADR below its rack rate. Adjustments on this report is the room charge corrections only, which is a subset of the adjustments row on the summary: the corrections made against restaurant and spa charges are not here. The filter panel offers a date range and nothing else.
Items and Services

Everything that is not a room, grouped by item rather than by folio, so it answers what sold rather than who bought it. Each row prices out: Quantity times Unit Price, less Discount, is Net Revenue, and net plus Tax/Service Charge is Total Amount.
The figure that ties back to the summary is Net Revenue, not Total Amount. The Items and Services row on the snapshot is revenue before tax, so the report will always look larger than the row that opened it unless you read the right column. Filter by Category to answer what the restaurant took without leaving the report, or by Item Name to follow one product.
Adjustments
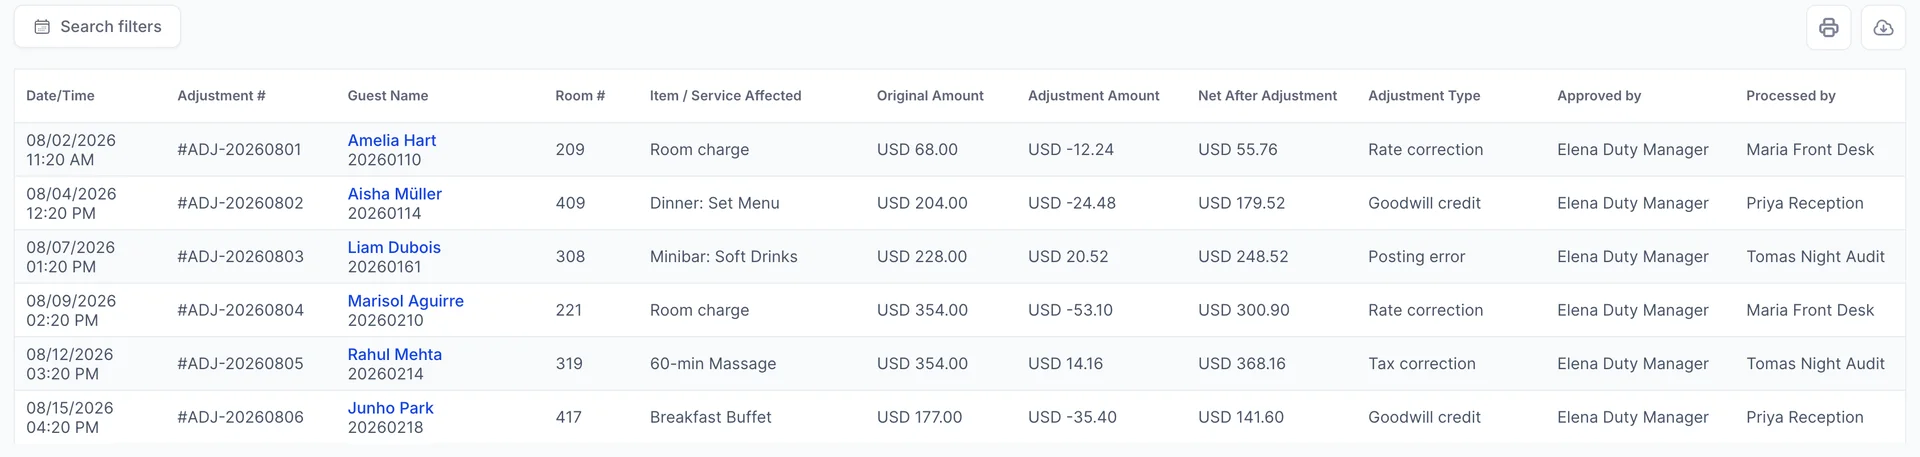
Every correction made to a charge that was already posted, with the charge before it, the change, the charge after it, and the two names that matter in a dispute: who approved it and who keyed it. The guest name links to the reservation, so you can go from a correction to the folio it changed in one click.
Adjustment Amount is signed. Goodwill credit and Rate correction are usually negative, while a Posting error or a Tax correction can go either way, which is why the monthly total is not the size of the problem. A month of small offsetting corrections nets to almost nothing and still tells you the desk is posting badly. Filter by Adjustment Type or Approved by to see that pattern rather than the net.
Payments received and its three reports

These three rows are counts. A row reading 11 means eleven reservations, not eleven of anything else, and the money is in the report behind it. The three do not overlap, which is what makes them worth reading side by side.
| Row | Counts | Its report adds |
|---|---|---|
| New Reservations Paid in Full | Bookings made in the period that were settled outright | Rate Plan, Total Paid and Payment Method |
| New Reservations with Deposits | Bookings made in the period that have paid part of the total | Deposit Amount Received and a deposit due date filter |
| Reservations Balance Paid | Older bookings whose remaining balance was cleared in the period | Deposit Paid beside Balance Paid |
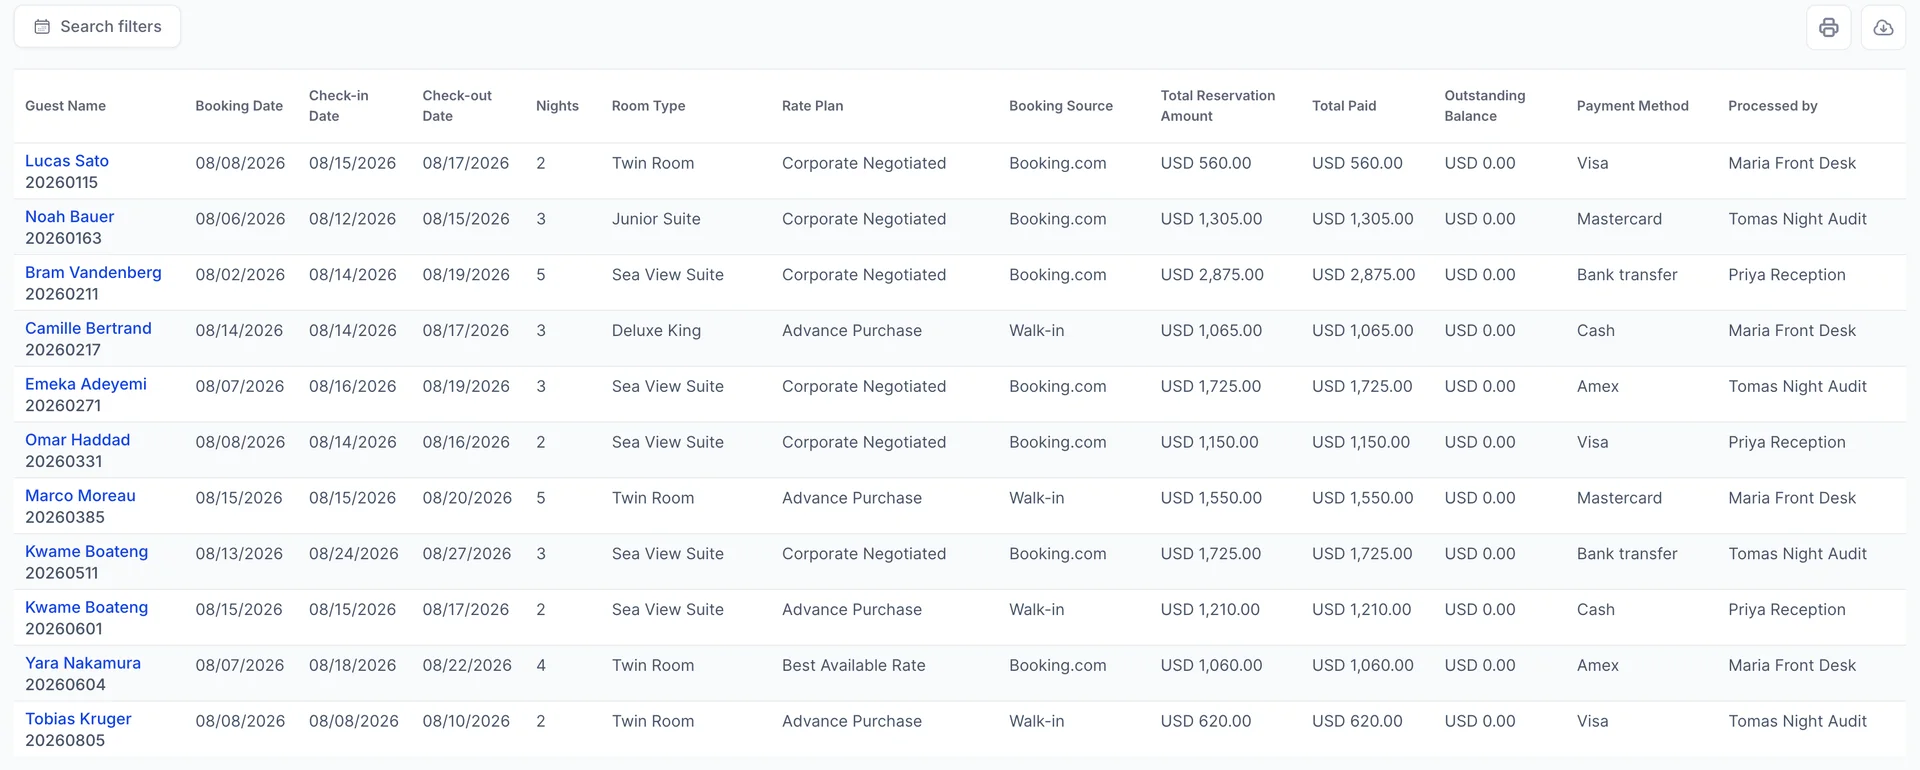
All three list one row per reservation with the guest, the stay dates, the room type, the source, the total and the outstanding balance, and all three carry the same filters: booking number, guest name, room type, booking source, payment method and the member of staff who took the money. Two of them add a column of their own, and the deposits report adds a second date range for when the deposit falls due.
The count that moves first in the morning is Reservations Balance Paid, because that is where check-out settlements land. A day with arrivals but no balances paid usually means the desk is taking payment at check-out rather than on arrival, which is visible here before it is visible anywhere else.
The 14-day outlook

Fourteen columns starting on the selected date, so the first one repeats the night the rest of the screen is about and is the quickest check that you are reading the date you think you are. The other thirteen are on the books rather than forecast: they count the reservations that exist now, so a date three weeks out reads low because it has not been sold yet, not because it is going to be quiet.
Read the ADR row across rather than the OCC% row. A weekend at 87% and a rate below the fortnight's average is the pattern worth acting on, because it is the one you can still fix by closing a discount.
Making the numbers agree
Every figure on this screen belongs to another screen as well. When two of them disagree, one of these is why.
- Rooms Occupied, ADR and REVPAR for the selected night match House Status and the occupancy reports for the same night. They are computed from the same rooms sold and room revenue.
- Room Only Revenue for the month equals the Gross Room Revenue column of its report added up, and the room nights on that report add up to the occupied rooms across the days the range covers.
- Items and Services equals the Net Revenue column of its report, before tax.
- Each Payments received count equals the number of rows in the report it opens, once both are looking at the same range.
If a drill-down total is bigger than the row you clicked, check its date range first. That is the difference nine times out of ten, because the reports open on the month to today and the summary may be showing an earlier date.
What this report will not do
- No range on the summary. One day at a time. For revenue over a period, use the room revenue reports or the occupancy and rate reports.
- No sorting and no paging on the drill-downs. Column headings are not clickable and every matching row renders at once. Narrow with Search filters.
- No forecast. The outlook is on the books today, not a projection, and it does not adjust for pickup.
- Nothing here takes a payment. Charging a folio and settling a balance both happen on the reservation.