These three reports answer what the property sold besides rooms. All three read the same folio postings, so they never disagree about the money, only about how finely it is cut: one row per item, the same rows grouped into categories, and those categories again against the same period last year.
Three reports, one ledger
| Report | One row per | Answers |
|---|---|---|
| Revenue by Items & Services | Item in the property's catalogue | Which products earn, and which ones you are still stocking for nothing |
| Revenue by Item Categories | Category the items are filed under | Which department earns, without reading forty product lines |
| Revenue Comparison YoY | Category, plus one room revenue line | Whether each department is ahead of where it was a year ago |
The first two are the same screen with a different grouping, down to the toolbar and the column headings. The third is a different shape: it has no date range, it adds the room revenue the other two leave out, and it is the only one of the three that compares anything.
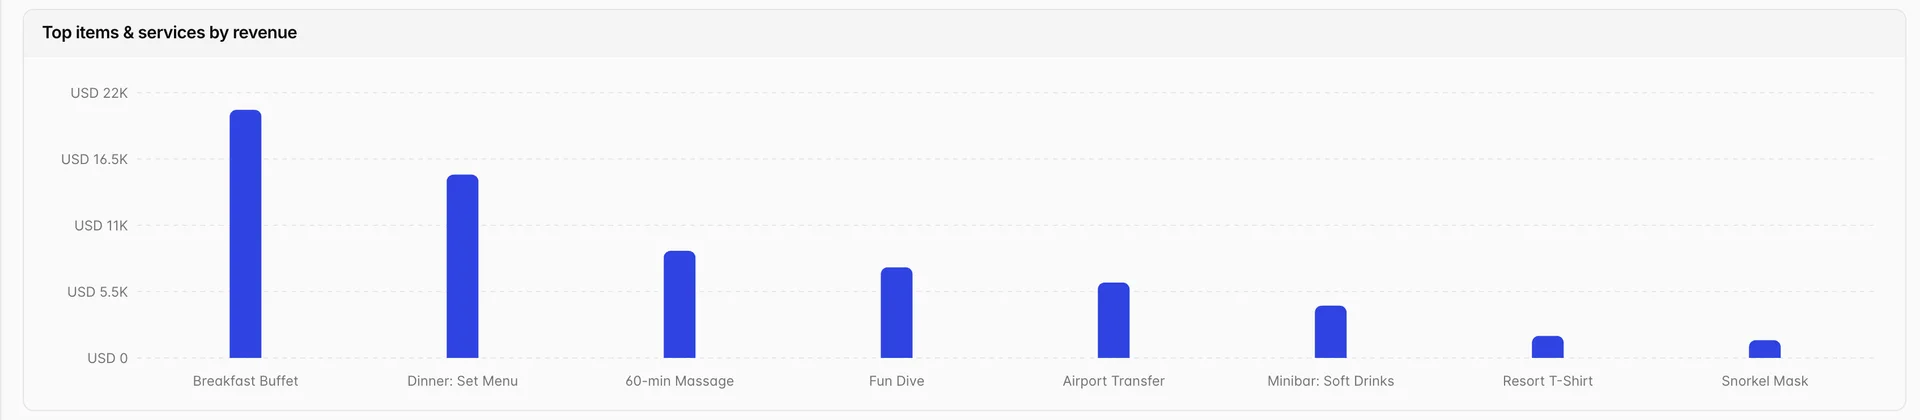
The chart draws the ten highest earning rows, sorted by Amount. A property with a long catalogue therefore gets a chart of its best sellers and a table of everything, which is the right way round: the eleventh best selling item is a table row, not a bar worth looking at.
Amount, MTD and YTD
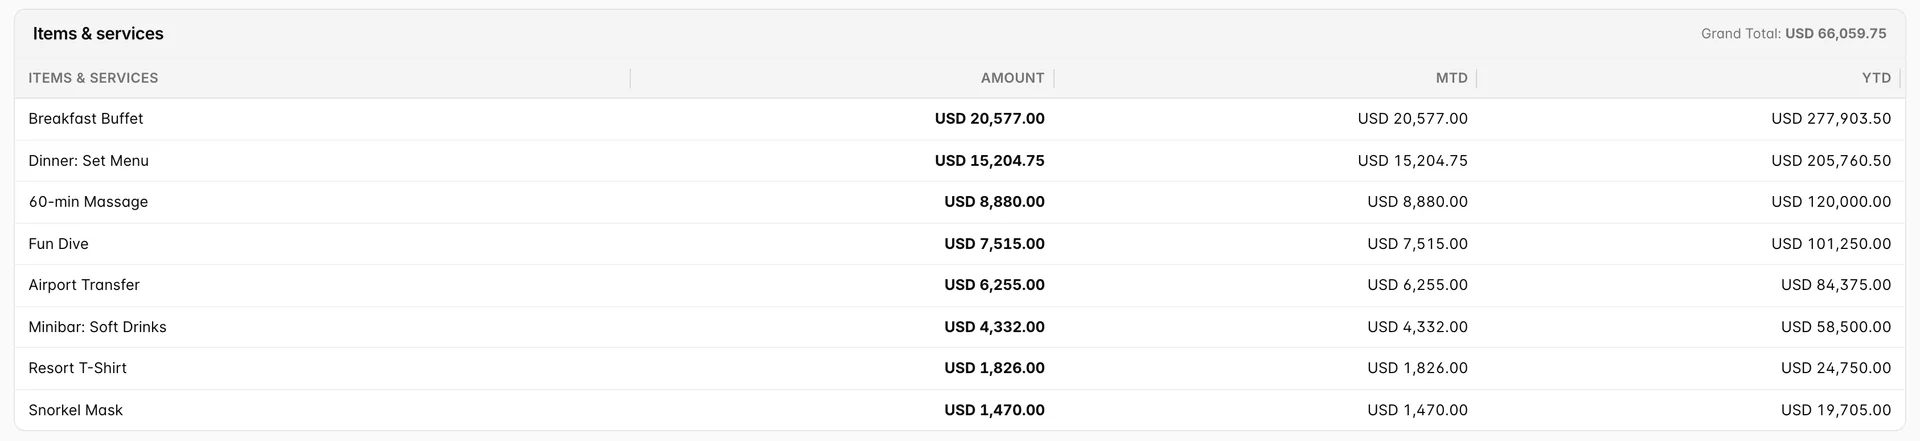
Only the first money column answers your question. Amount is the revenue in the range set in the filter panel. MTD is the first of the current month to today and YTD is the first of January to today, whatever range you asked for. Set the range to last February and the row still ends in this month's and this year's figures.
Grand Total beside the table heading is the sum of the rows on screen, so it follows the filter. Narrow to one item and the grand total becomes that item, which makes it a running total of your current question rather than a property total you can quote.
The filter panel
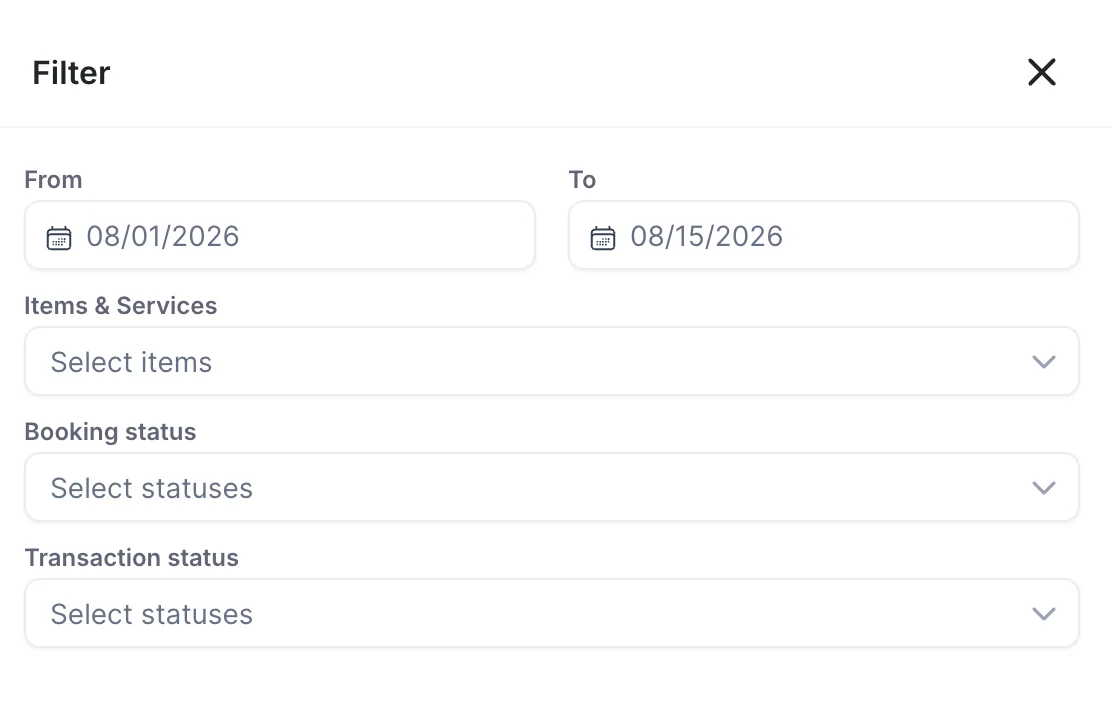
Search filters opens the panel. The two dates set the Amount column. Items & Services lists every add-on and product the property sells, with Select all at the top, and picking none is the same as picking all of them. Booking status holds the eleven reservation states from Reserved to Tentative, and Transaction status holds Posted, Paid and Voided. Nothing is applied until you press Save, with one exception: Reset all filter clears the pickers, puts the range back to the first of the month and reloads the report there and then.
On the categories report the third field is Item Category instead, listing the categories rather than the products. Everything else in the panel is the same.
A range with no postings in it does not error. The report replaces the chart and table with an empty state offering the filters again, which is the answer to a range set in the future rather than a fault.
The same rows, grouped by category

Eight items became six categories and the grand total did not move. That is the whole relationship between the two reports, and it is worth checking the first time you use them: run both over the same range and the totals match, or an item is filed under a category you did not expect.
The categories are the ones on the products themselves, set where the item is defined rather than on the report. A drink filed under Food & Beverage instead of Minibar is not a reporting problem you can fix here: it moves between the two lines only when someone recategorises the product, and every past month moves with it.
Revenue Comparison YoY
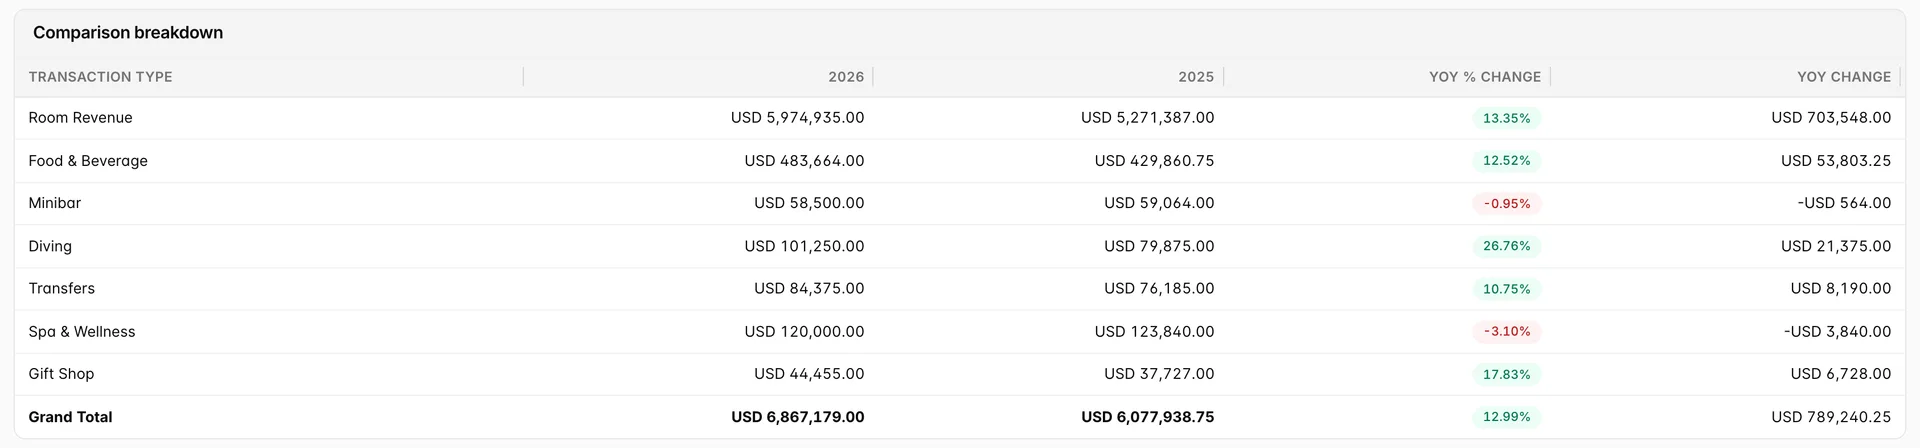
One row for room revenue, one for each item category, and a bold grand total. The two money columns are headed with the years themselves, so the left figure is the year in the toolbar and the right is the year before it. YOY % Change carries a green badge when the line grew and a red one when it shrank, and YOY Change is the same movement in money.
Both columns cover the same elapsed part of their year. In the middle of August the report compares January to 15 August 2026 against January to 15 August 2025, not against the whole of 2025, which is what makes the percentages worth reading before the year is out. The calendar button in the toolbar offers the current year and the nine before it, and reloads the report on selection.
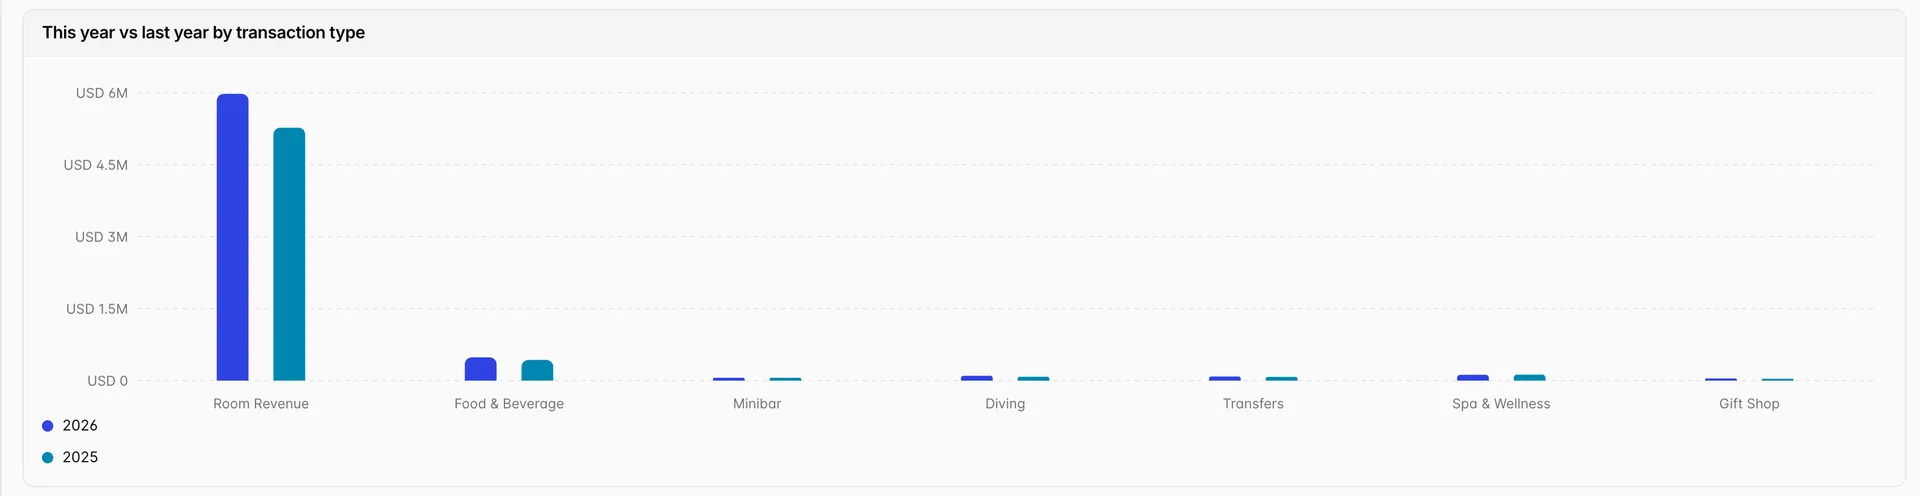
The chart puts all seven lines on one axis, and rooms are two orders of magnitude above the rest, so the six category pairs flatten against the bottom. Read the room line off the chart and the categories off the table. Hovering a pair gives the exact figures if you want them from the chart anyway.
Making the numbers agree
Four sums tie these reports to each other and to the rest of Reports. When one of them is out, the reports are not disagreeing about the money: something in between has changed.
| This figure | Equals |
|---|---|
| Grand Total on the items report | Grand Total on the categories report, over the same range |
| The MTD column added up | The Items and Services month to date on the Daily Revenue Report |
| A category's YTD | The same category's current year column on Revenue Comparison YoY |
| Room Revenue on the year-on-year report | The months to date on the Occupancy Report, added up |
The last of those is the one to reach for when a general manager queries the room line. The occupancy report holds room revenue by month, so adding January to the current month gives the same figure the year-on-year report shows, give or take the part-month you are standing in.
What these reports will not do
- No rooms on the breakdowns. Revenue by items and by categories cover extras only. Room revenue appears on Revenue Comparison YoY and on the room reports, not here, so the grand total is a fraction of what the property took.
- No guest or folio detail. A row is a total, not a list of who bought it. Go to Daily Charges by Item for the individual postings behind an item.
- No range on the year-on-year report. The comparison is always year to date against year to date. There is no way to compare a single month against the same month last year on this screen.
- No date range in the export. Export writes what is on screen to PDF or Excel, with the printer icon producing the same PDF for printing, so the range lives in the filter panel rather than in the file name.
Both breakdown reports and the year-on-year report are permissioned separately: Revenue by items & services, Revenue by item categories and Revenue comparison year-over-year are three entries under finance reports, so a role can hold one without the others.