These three reports count reservations. The revenue reports next to them in the Reports hub value the same stays, and the two answer different questions: revenue tells you what a rate plan earned, this tells you how many people chose it, how far ahead, and how often they changed their mind. For the money view, see room revenue by source, type and plan.
Counted, not valued
All three carry a Filter Report button and nothing else, so the shared toolbar behaviour described in finding and filtering reports applies here with one exception: there is no export at all on these screens, not even a broken one.
By rate plan: which rates are worth keeping
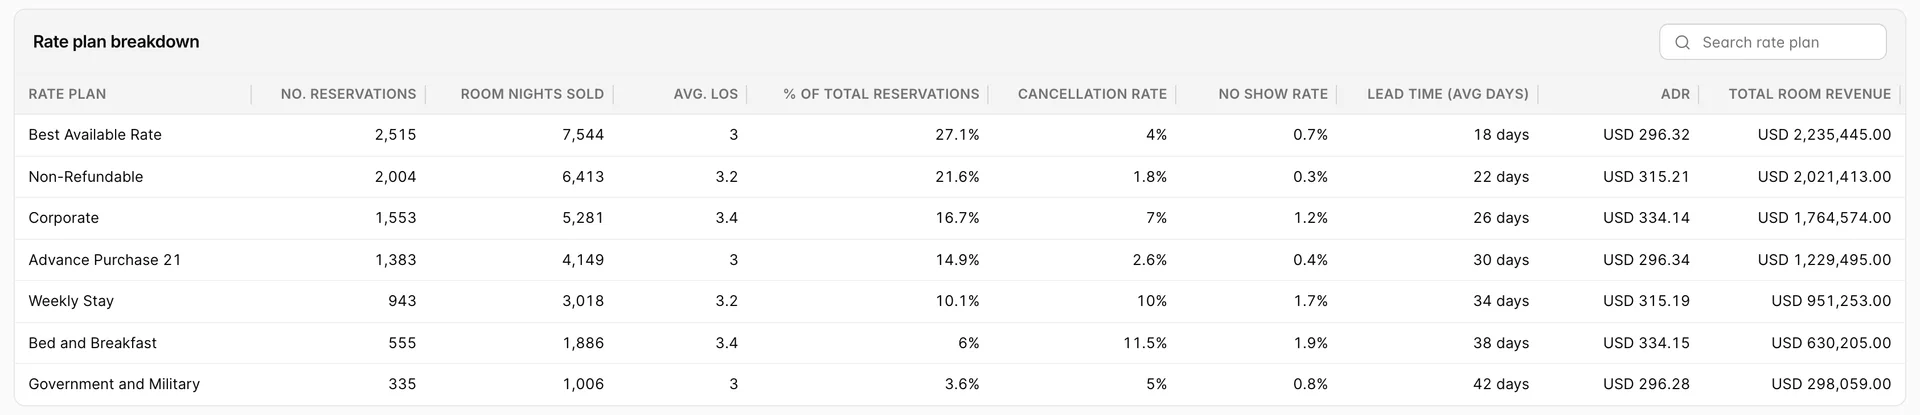
Read this table as a set of trades rather than a ranking. A rate plan is a bargain you offer: a lower rate in exchange for something you want. The columns tell you whether the guest kept their side of it.
| Column | What it tells you |
|---|---|
| No. Reservations and % of Total Reservations | How much of the house that plan is filling. A plan under a few percent is not paying for the work of maintaining it. |
| Room Nights Sold and Avg. LOS | Whether the plan brings long stays or short ones. A discount that buys longer stays is usually worth more than the same discount spread over one-nighters. |
| Cancellation Rate and No Show Rate | Whether the restriction is doing its job. A non-refundable rate cancelling as often as the flexible one means the restriction is not being enforced, or the guests booking it did not understand it. |
| Lead Time (Avg Days) | How far ahead the plan sells. Advance purchase rates should sit well above the flexible rate here. If they do not, you are discounting bookings you would have taken anyway. |
| ADR and Total Room Revenue | What the plan actually achieved per night and in total. These match the room revenue by rate plan report over the same range, so use either. |
The Search rate plan box in the section heading filters the table as you type. It leaves the chart above it alone, so a search narrows the rows without narrowing the bars.
Two columns that are switched off
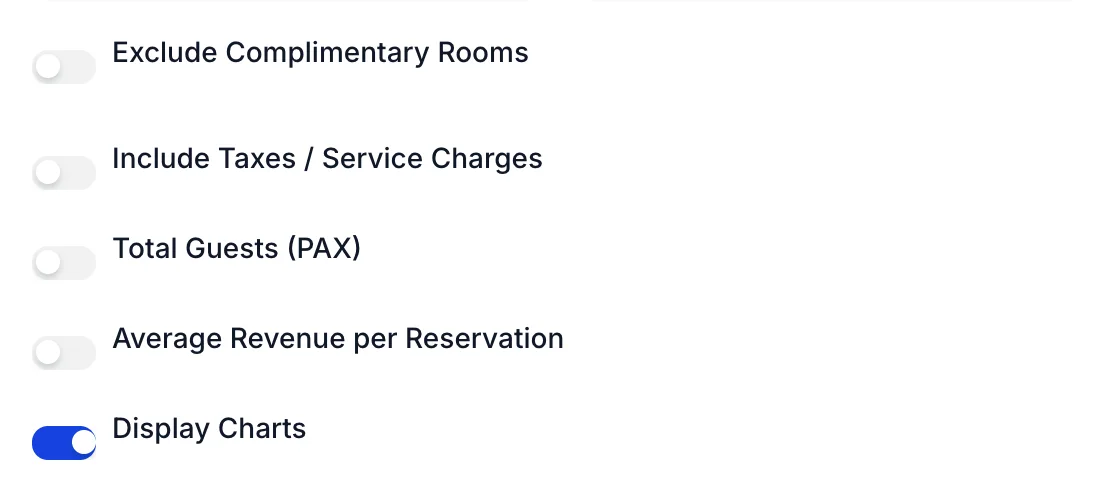
Total Guests (PAX) and Average Revenue per Reservation each add a column to the table and are off until you turn them on. PAX is the one to reach for when you are sizing breakfast or housekeeping rather than revenue, because two plans with the same room nights can carry very different numbers of people.
The other three change the figures rather than the layout. Include Taxes / Service Charges raises every money column including ADR, Exclude Complimentary Rooms drops zero-rate stays that otherwise pull ADR down, and Display Charts hides the chart above the table. Nothing applies until you press Save Changes.
By country: where the demand comes from
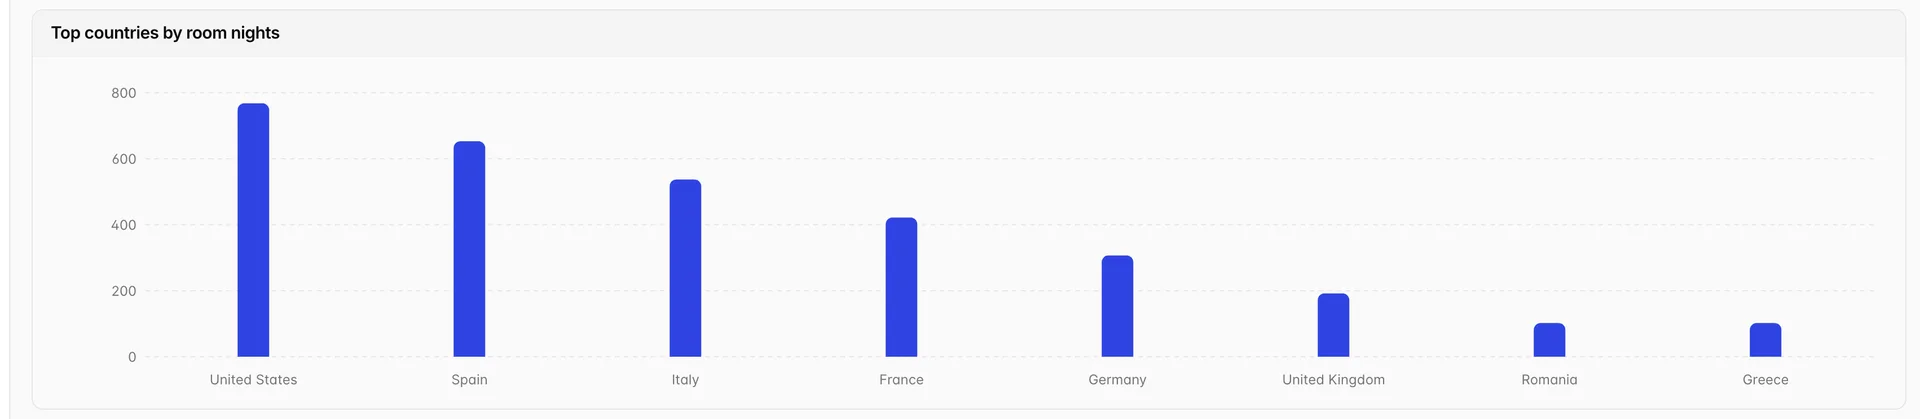
The chart takes the top twelve countries by room nights and sorts them. The table below keeps the order the report came back in and lists every country, so the two do not read top to bottom the same way.
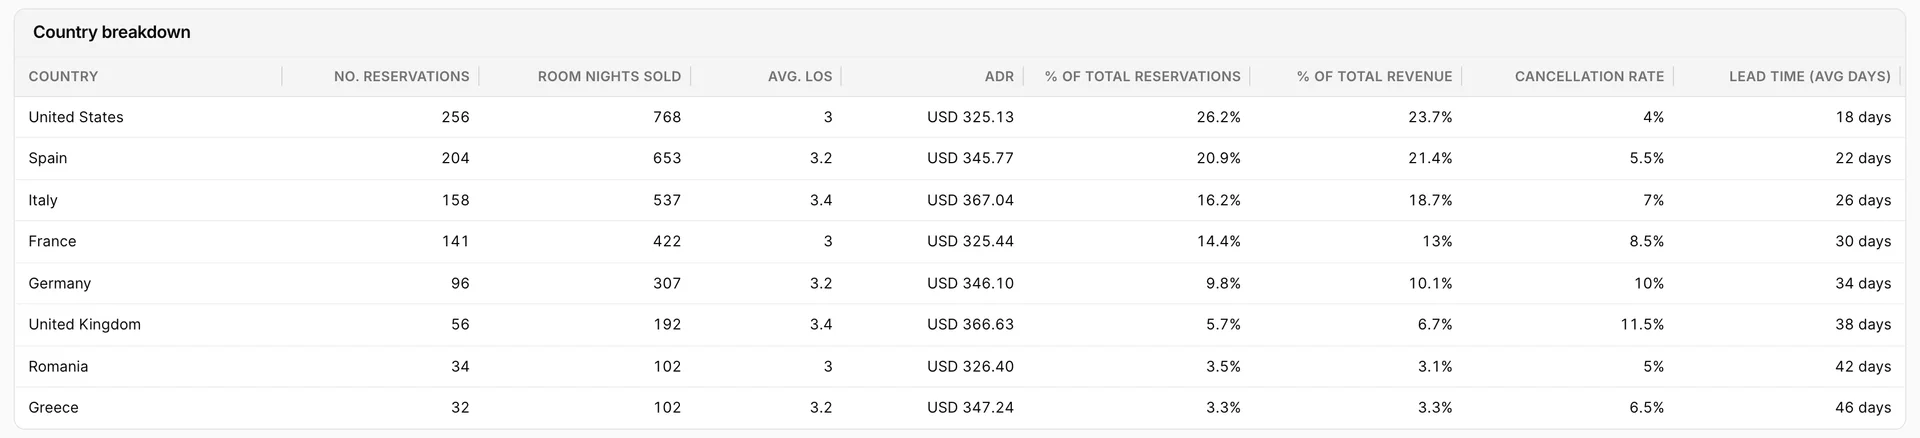
The pair of share columns is the reason to open this report. % of Total Reservations against % of Total Revenue tells you whether a market is worth what its volume suggests. A country sending a quarter of your bookings and less than a quarter of your revenue is booking your cheaper rooms; the reverse is a market you should be spending acquisition money on.
Lead Time matters more here than anywhere else in the product, because it is what tells you when to open a market. A market that books six weeks out has already made its decision by the time a four-week campaign reaches it.
By booking date: pace
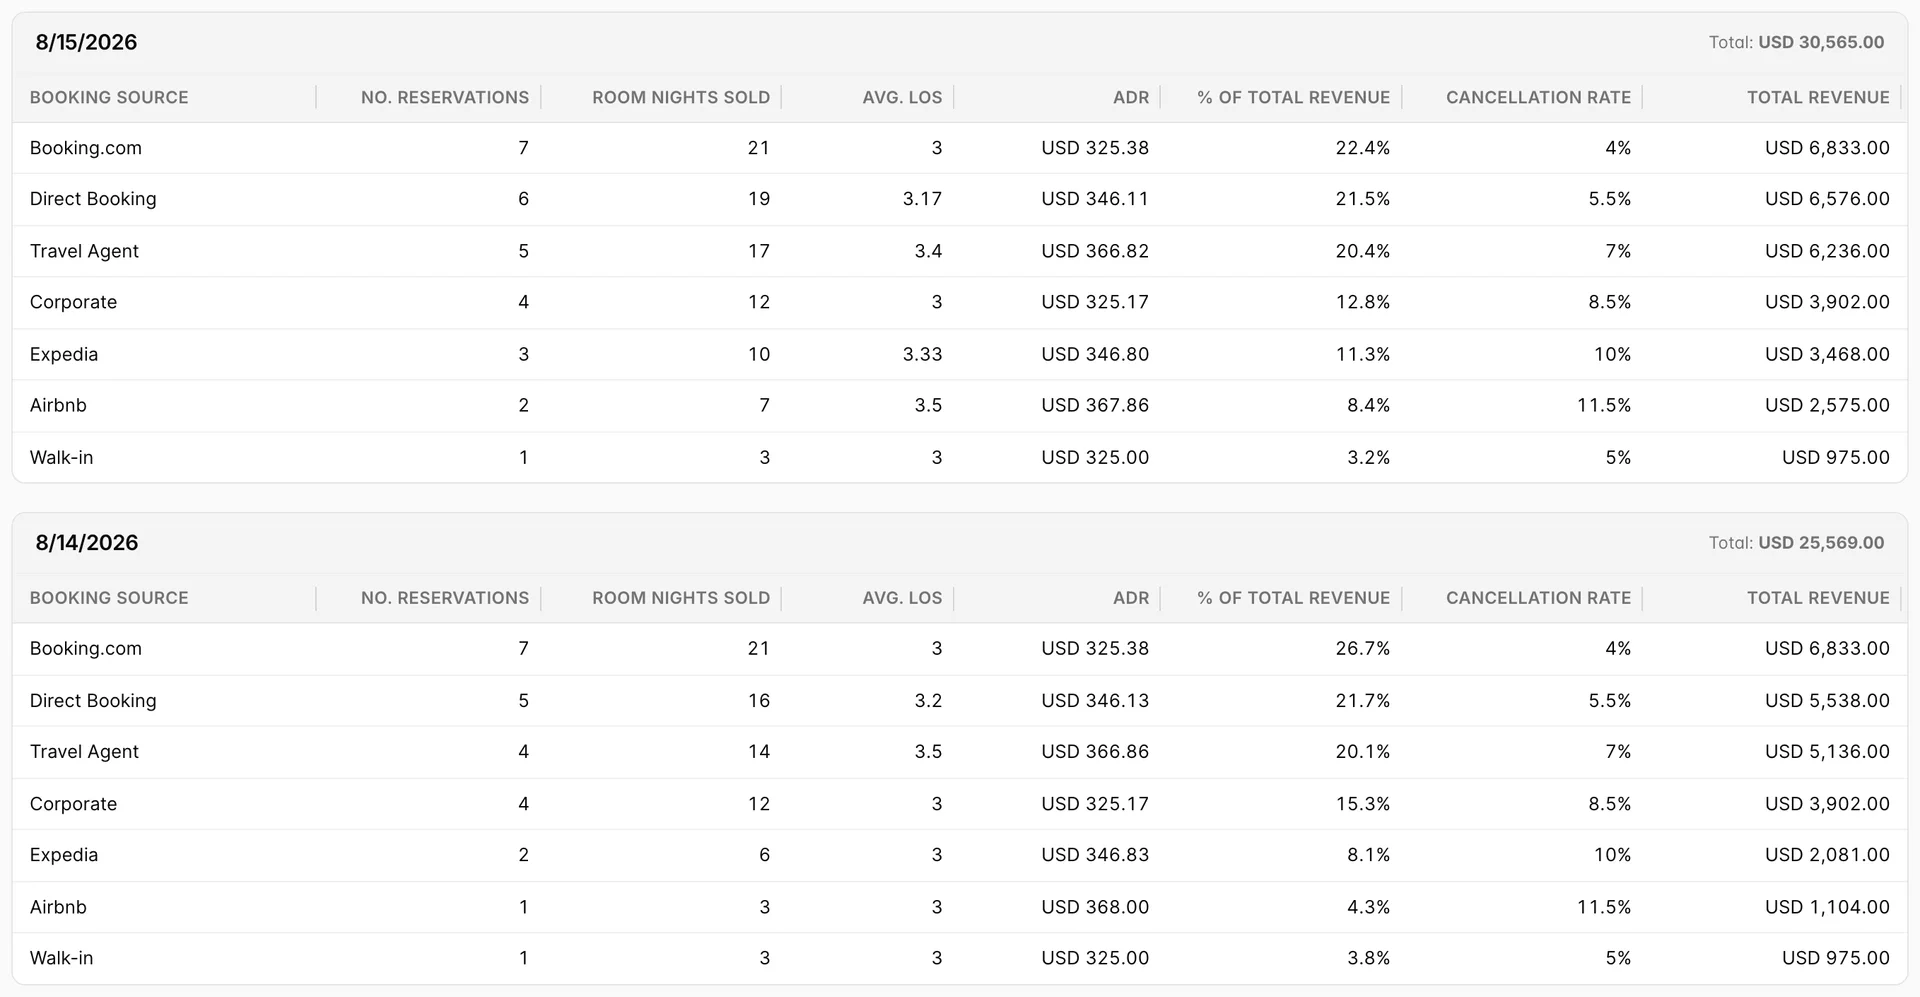
This one is shaped differently. Instead of one table, it stacks a section per booking date, newest first, each with the day's revenue beside the heading and a table splitting that day by booking source. It is the only report in the group where a row is a day's work rather than a category.
Use it for pace: how many bookings arrived yesterday, at what rate, and through which channel. Two days side by side answer questions a monthly total cannot, such as whether the rate you dropped on Tuesday brought volume on Wednesday, or whether a channel went quiet. % of Total Revenue is that source's share of that day, not of the month, so it always adds to 100 within a section.
Three reports, three default ranges
The three do not open on the same window, which is the usual reason two of them disagree when you expect them to match.
| Report | Opens on | Grouped by |
|---|---|---|
| Reservations by Rate Plan | The last twelve months | Rate plan |
| Reservations by Country | The last month | Guest country |
| Reservations by Booking Date | The last month | Date the booking was taken, then source |
None of the three has the Date Frame selector the revenue reports carry, so there is no stay date against booking date switch here. Rate plan and country count stays in the range; booking date groups by the day the booking was taken. Set the ranges to match before you compare any two of them, and remember that each report keeps its own filters.
What these reports will not do
- No export. These three carry a filter button and nothing else. Print from the browser if you need a copy.
- No sorting. Column headings are not clickable. The chart is the only ranked view, and only on the rate plan and country reports.
- Booking date can be a long page. A month of bookings is a month of sections. Narrow the range rather than scrolling.
- A failed request looks like an empty report. All three show No reservations found whether the query returned nothing or the request failed, because the error only reaches the browser console. If a range you know has business comes back empty, that is worth reporting rather than believing.