This report turns a fortnight of task sheets into one row per attendant. It is the only screen in Prostay that looks back at housekeeping work rather than at the work still to do, and it is the one people reach for before a review, a roster change or an argument about whether a floor is understaffed.
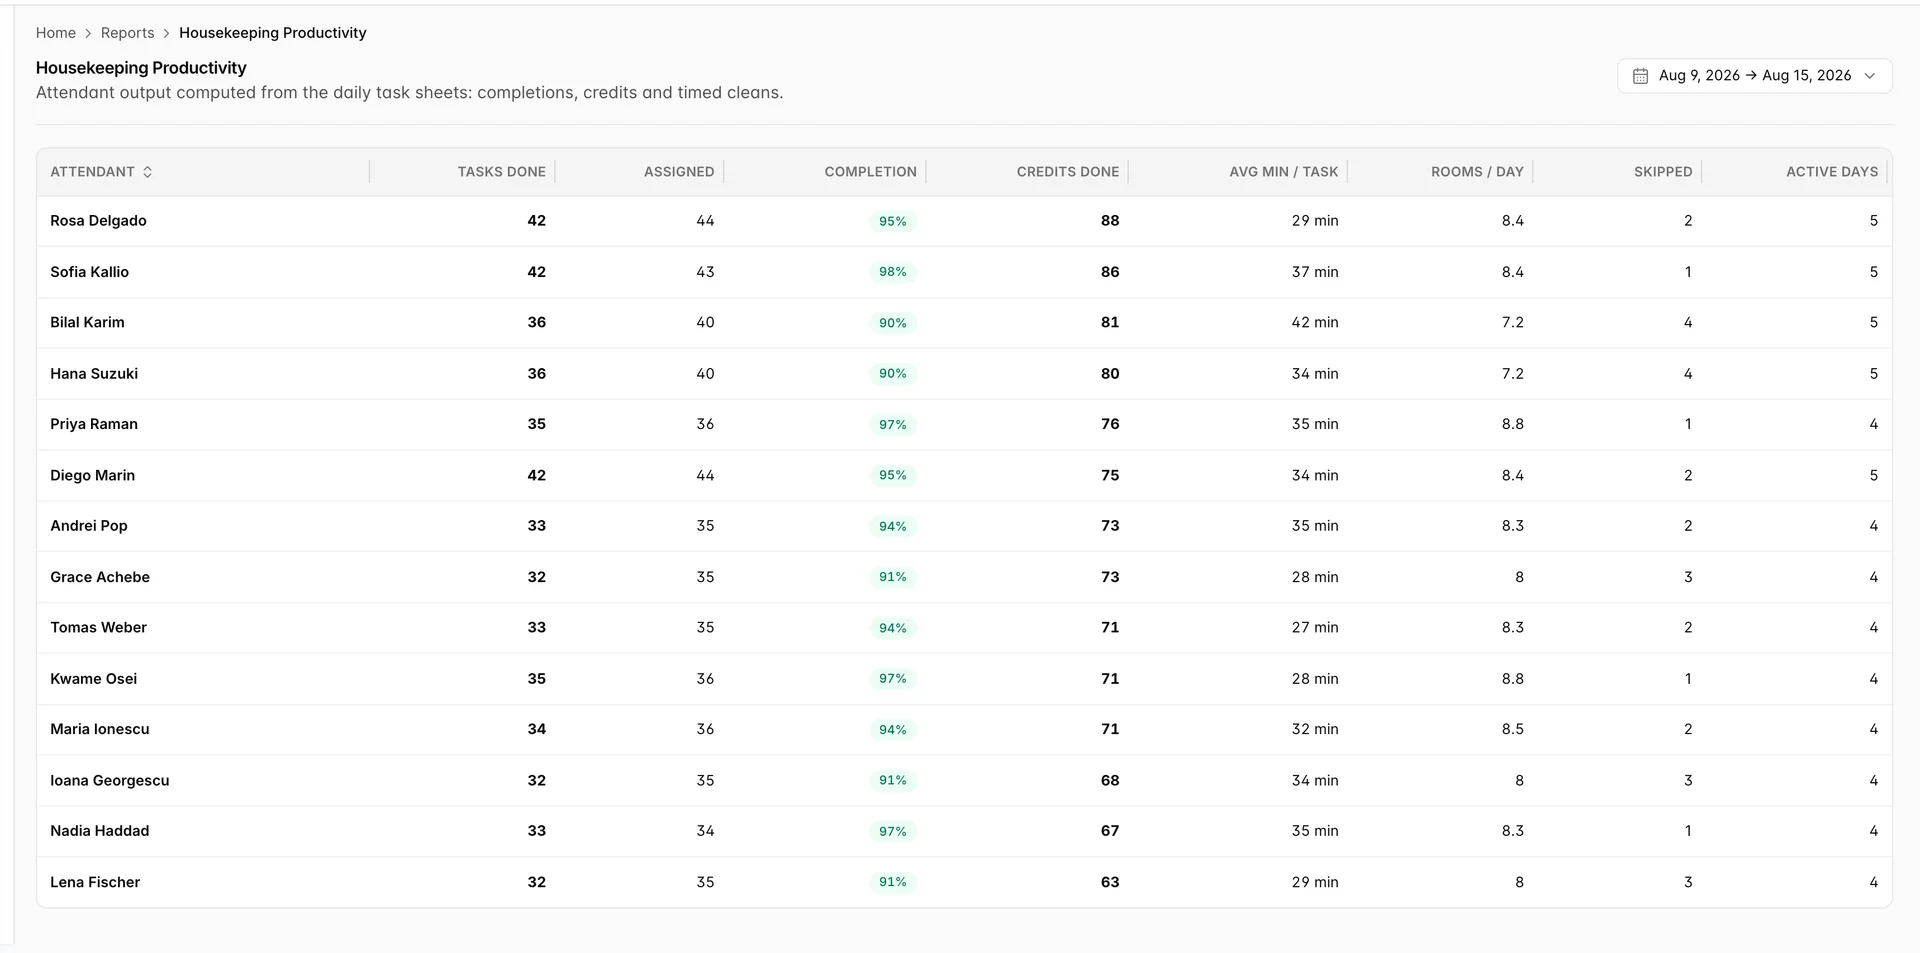
What the report counts
Everything on this screen comes from saved task sheets, and nothing else. A day with no sheet contributes nothing, whether or not anybody cleaned anything, so the report measures work that was generated onto a sheet and then marked off in My Tasks. Rows are ordered by credits done, so the person with the heaviest completed workload is at the top.
Today usually contributes nothing either, and that trips people up. A sheet generated this morning is full of tasks nobody has finished yet, so including today drags every completion rate down. The report is honest about it rather than clever: it counts what the sheets say at the moment you run it.
Choosing the period

There is one control: the date range, which opens on the last seven days ending today. Pick new dates and the table reloads. There is no filter bar, no export menu and no search, so unlike the other reports in this module there is nothing to save or download here.
The nine columns

| Column | What it counts |
|---|---|
| Tasks done | Tasks marked done across the period. A task, not a room: a departure clean and a turndown in the same room are two. |
| Assigned | Every task that landed on their sheets, done or not. |
| Completion | Tasks done over tasks assigned. The badge is green at 90 per cent and above, orange from 60 to 89, and grey below that. |
| Credits done | The cleaning credits on the completed tasks. This is the workload column, and the one the table sorts by. |
| Avg min / task | Wall-clock minutes between pressing Start and pressing Done, averaged over the completed tasks that have both stamps. A dash means none of them did. |
| Rooms / day | Tasks done divided by active days, to one decimal. Despite the name it counts tasks, so a turndown counts as a room, and so does the lobby. |
| Skipped | Tasks explicitly marked skipped. A task simply left alone is not skipped: it stays pending and only shows up in the gap between done and assigned. |
| Active days | Days in the range on which they were given a sheet with at least one task on it. The divisor for rooms per day. |
Two of these are worth spelling out because they are not what the header suggests. Rooms / day is per active day, not per day in the range, so somebody who worked two days and cleaned sixteen rooms reads 8.0, the same as somebody who worked five days and cleaned forty. And Avg min / task only sees tasks that were actually timed. An attendant who works through a sheet and ticks everything off at the end of the shift shows a dash or a nonsense average, not a fast one.
Reading a row without being unfair
The temptation is to sort by one column and call it a ranking. The columns disagree with each other on purpose, and the disagreements are where the useful information is.
In the shot above, Rosa Delgado and Sofia Kallio both did 42 tasks. Rosa averaged 29 minutes a task and Sofia 37, which looks damning until you notice that credits done is 88 against 86 and the two are doing much the same volume of work: the difference is what was on the sheets, and suites take longer than standard doubles. Bilal Karim's 42 minutes with four skipped is a different shape of number and worth a conversation, though "four rooms had the sign on the door" is as likely an explanation as anything about Bilal.
Low completion on one attendant is usually a story about that person's day. Low completion across everybody on the same dates is a story about the sheets: too much house for the people rostered. The Housekeeping forecast is the screen that would have warned you, and it is covered in the task sheets article.
When the report is empty
An empty state reading No productivity data means no saved task sheet falls in the range. The usual causes, in the order they are worth checking:
- The range covers days before you started generating sheets.
- The range is today only, and today's sheet has not been generated.
- Sheets exist but every task is still pending, which is a table of zeroes rather than an empty state.
If the screen instead says No access to this report, your role is missing the Housekeeping task sheets permission. It is the same permission that governs the task sheets screen itself, so anyone who can generate sheets can read this.
What this report will not do
- No export and no print. There is no toolbar. To get these numbers into a spreadsheet you have to copy them off the screen.
- No drill-down. Rows do not open. To see which rooms made up somebody's fortnight you have to go back through the task sheets day by day.
- No totals row. Nothing on the screen adds up the tasks or the credits for the property as a whole.
- No inspections. Only the attendant's own done and skipped marks count. Whether the clean passed a supervisor's check is not part of any column here.
- No trend. One period at a time, and no chart. Comparing this week with last means running it twice and writing the numbers down.