The Performance Center is the one screen in Reports with no table on it. It answers how full the house is, what the rooms went for, what they earned and which channels brought them, in eight cards you read rather than run. Nothing here filters anything else, and nothing exports: it is the summary you check first and then leave for the report that can show you the rows.
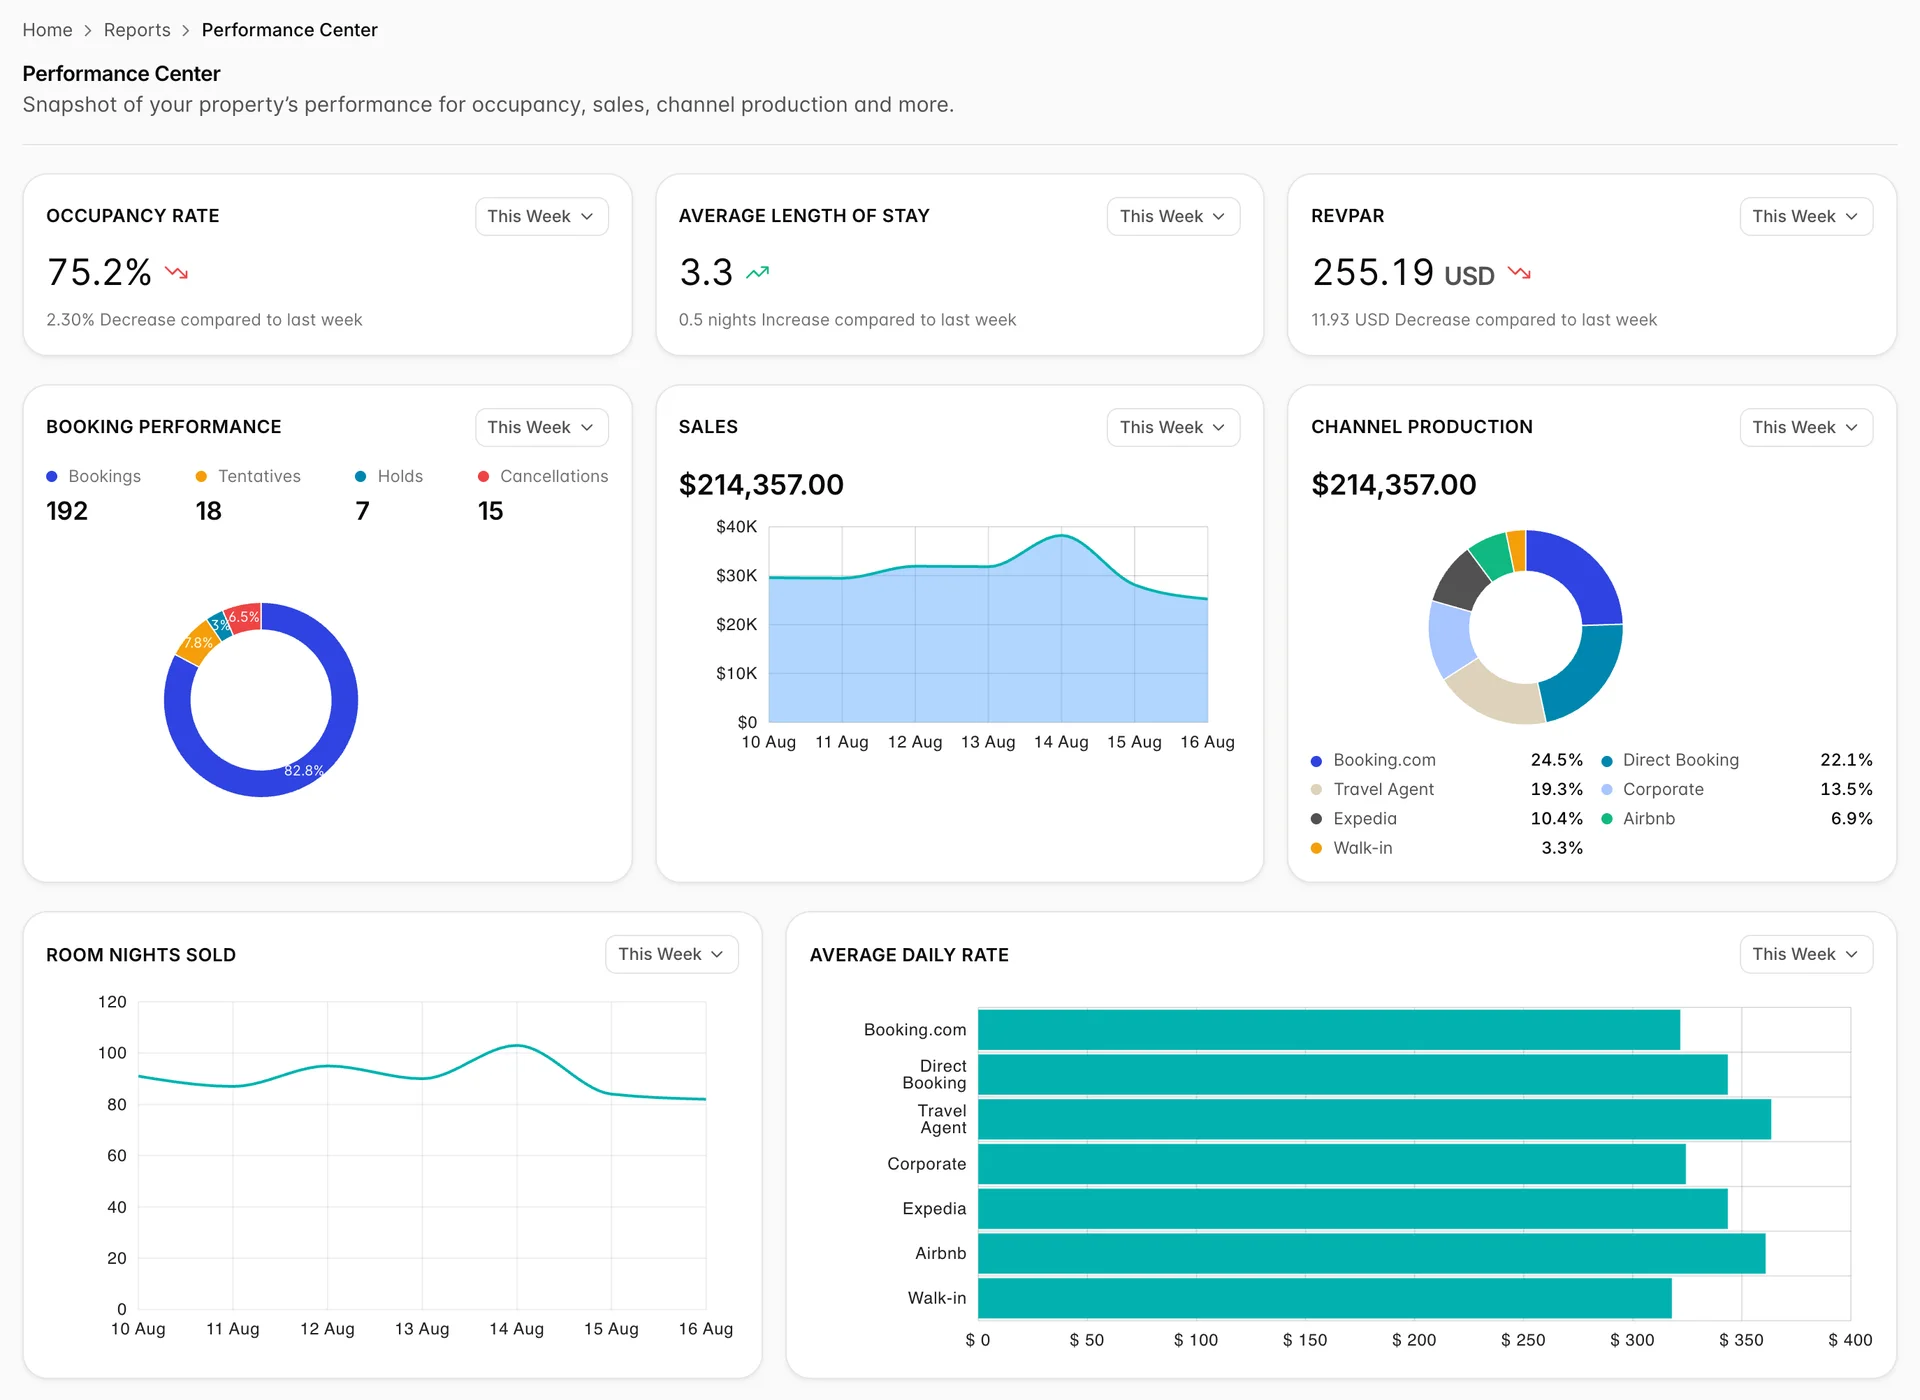
Eight cards, eight periods
Every card carries its own period menu and fetches its own figures. Changing the period on one card changes that card and nothing else, which is deliberate: it lets you hold occupancy on This Month while you page sales through the last three. It also means two cards sitting next to each other can be describing two different fortnights.
What each period means
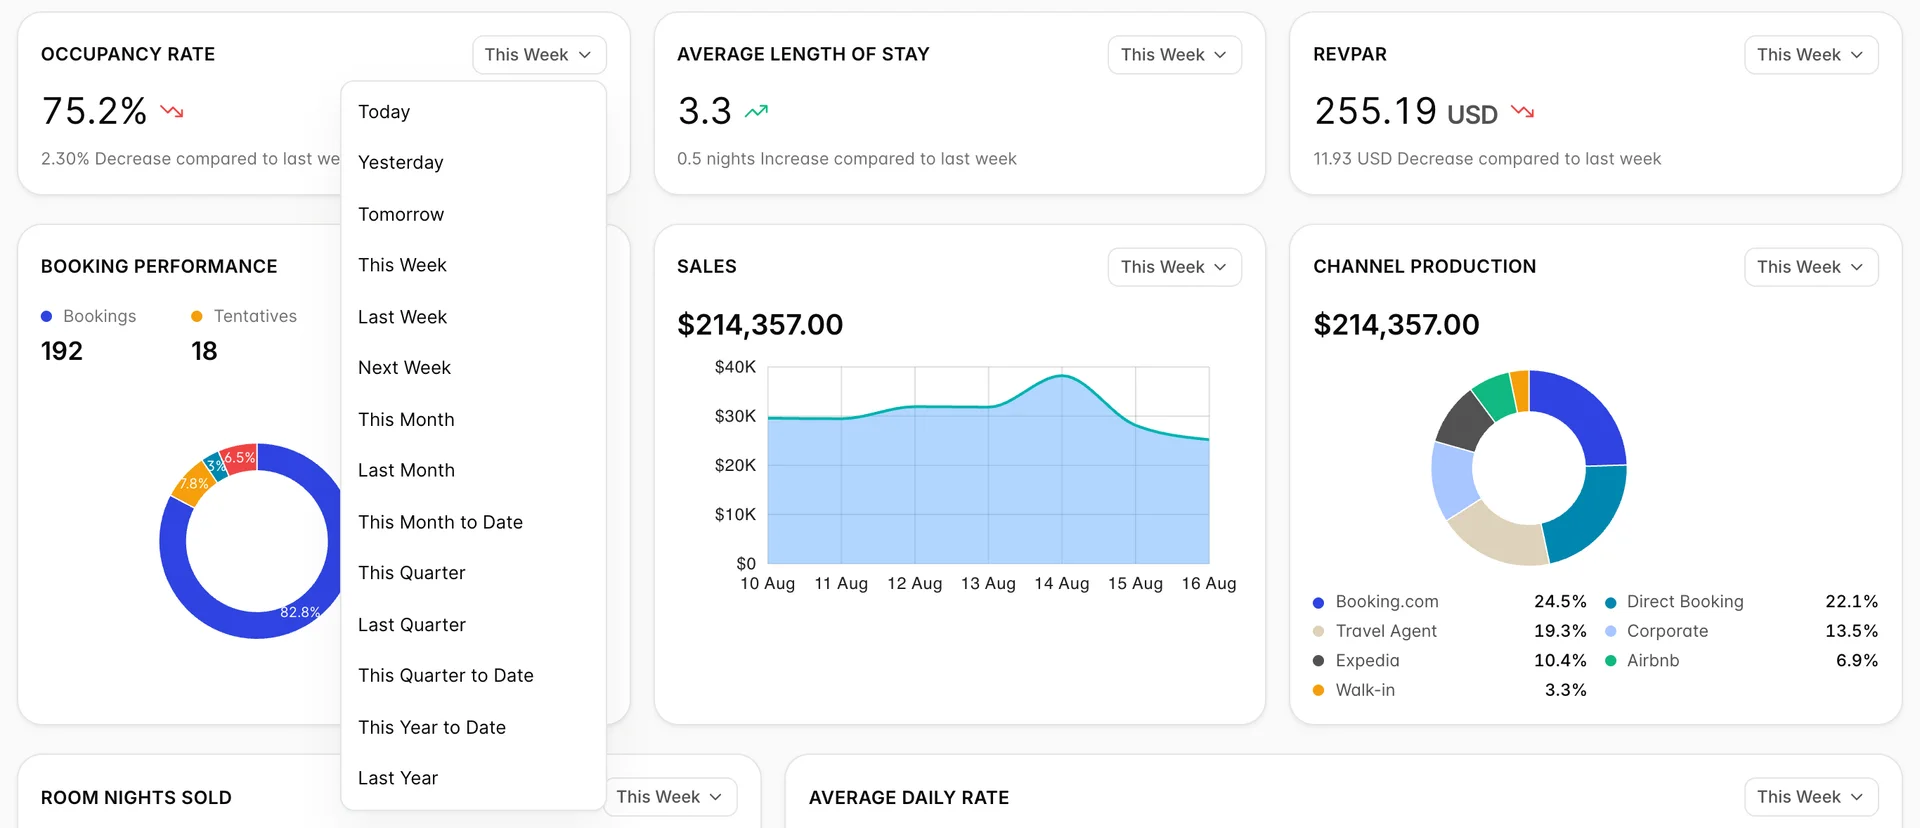
The fourteen options are calendar periods, not rolling windows. This Week is the Monday to Sunday you are in, This Month is the whole month and This Quarter the whole quarter. All three therefore include dates that have not happened yet, counted from what is on the books. When you want trading that has actually happened, use This Month to Date or This Quarter to Date, which stop at today.
Booking Performance and Sales offer twelve of the fourteen: Tomorrow and Next Week are missing from those two menus.
The three tiles and what they compare against

Each tile shows one figure, an arrow and a sentence. The arrow is green when the figure is above the period before and red when it is below, and the sentence spells out the same comparison in the unit that belongs to it: percentage points for occupancy, nights for length of stay, and money for RevPAR. When the two periods land on the same figure there is no arrow and the sentence reads No change compared to.
| Tile | What it is | Compared against |
|---|---|---|
| Occupancy Rate | Room nights sold against every room night the property had to sell | The whole of the previous period, so This Month is measured against last month |
| Average Length of Stay | Nights per reservation across the period | The same period a step back, in nights |
| RevPAR | Room revenue divided by every room, sold or not, in the property currency | The same period a step back, as an amount |
The to-date periods compare like with like: This Month to Date is measured against the same number of days from the first of last month, not against the whole of it, so the fifteenth of a month is never being judged against a full thirty.
Bookings, sales and channels
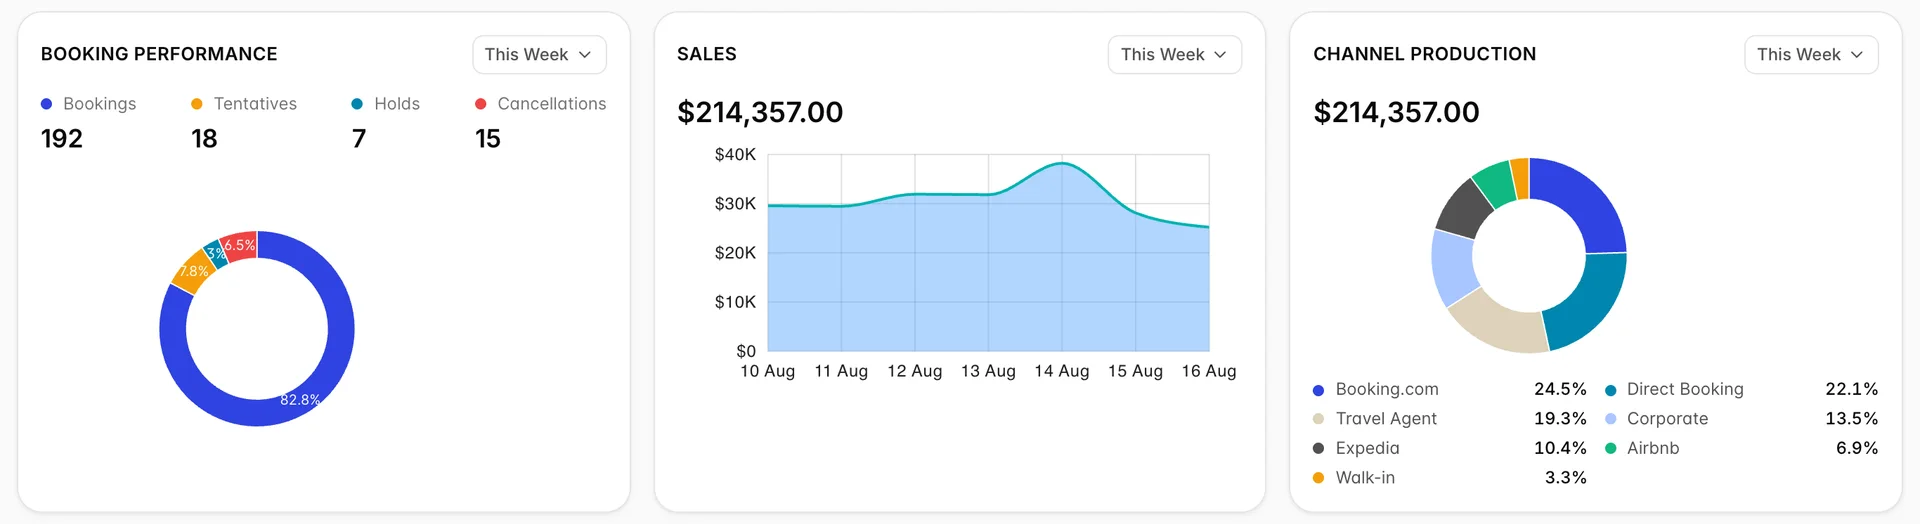
Booking Performance counts reservations for the period in the four states they can stand in: confirmed bookings, tentatives, courtesy holds and cancellations. The four counts are the donut's legend, and the dot beside each one matches its slice. Read the mix rather than the count. A cancellation share that climbs while bookings hold steady is a rate or a policy problem; a tentative pile that never converts is a follow-up problem. What tentatives and courtesy holds mean, and how long they last, is covered in blocks and holds.
Sales is room revenue for the period, totalled above the chart and plotted a day at a time. Quarter and year periods switch the line to one point per month. The shape is usually the week: in the shot above, Friday is the peak and Sunday the trough.
Channel Production is that same money split by booking source. The legend under the donut names each channel and its share, largest first. On the same period, the total over this donut and the total over the sales line are the same figure, which is the quickest check that both cards are answering for the same days.
Room nights and rate by channel
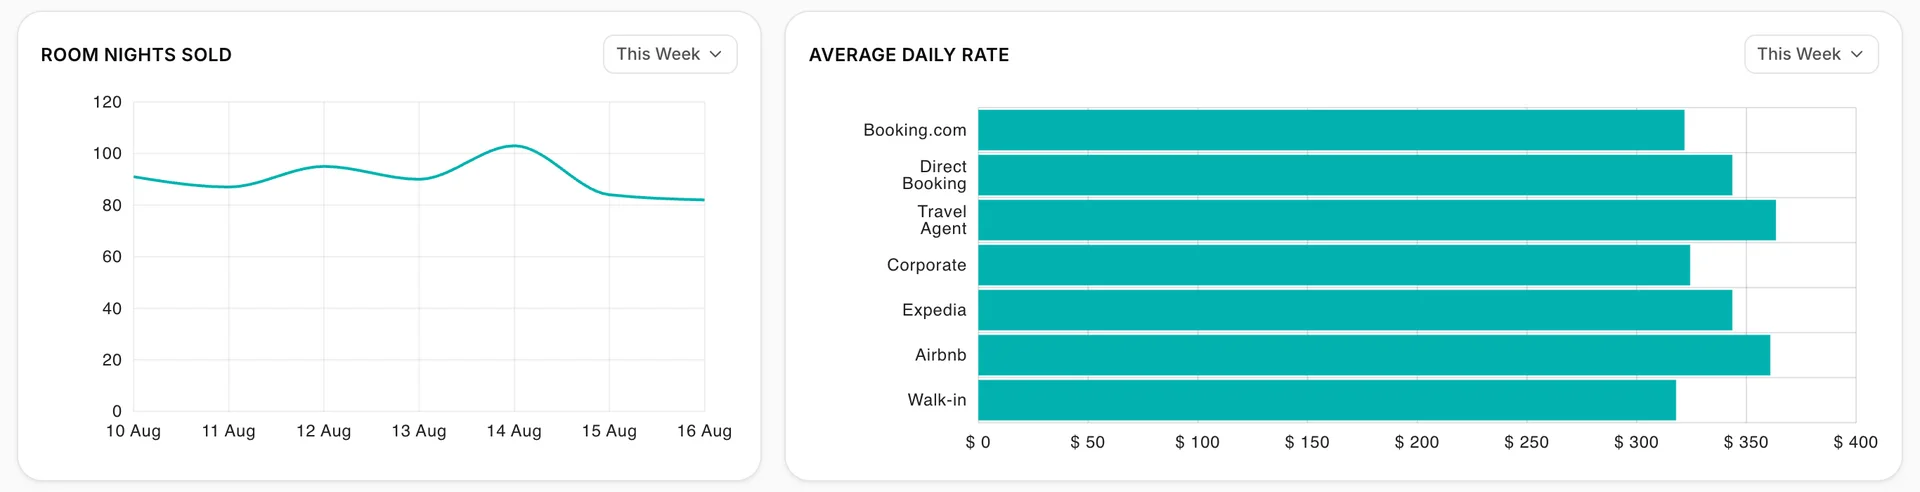
Room Nights Sold is the occupancy tile counted in rooms instead of percent. It is the card to bring to a housekeeping or staffing conversation, because a rota is built out of rooms occupied on a Friday, not out of a monthly average.
Average Daily Rate on this screen is per channel, not per day: one bar for each source, each of them that channel's room revenue over its own room nights. The bars average back to the property's rate for the period, so a channel above the pack is pulling the average up and one below it is dragging it down.
Checking it against the reports
Every figure on this screen is a summary of a report that can show you the rows behind it, and the two should agree whenever the dates do.
| Card | Report that details it |
|---|---|
| Occupancy Rate, RevPAR, Room Nights Sold | Occupancy, ADR and RevPAR, month by month with the room nights and revenue in columns |
| Channel Production, Average Daily Rate | Room revenue by source, type and plan, which lists each source's nights, rate and revenue |
| Sales | The finance reports, for what was actually charged and paid rather than what the rooms were worth |
The arithmetic ties together on the screen itself, which is worth knowing when something looks wrong. Sales divided by room nights is the rate the channel bars average to. Sales divided by rooms times days in the period is RevPAR. Room nights divided by rooms times days is occupancy. In the shots above, 214,357 over 632 room nights is a rate of 339, and over 840 available room nights it is the 255.19 on the RevPAR tile. Those same 632 nights over the same 840 are the 75.2 percent on the occupancy tile. When one of those does not come out, two cards are on different periods.
What this screen will not do
- No export, no print. There is no export menu and no print button anywhere on the Performance Center. To send a figure to somebody, run the report underneath it.
- No custom date range. The fourteen periods are the whole of it. A range like 3 to 17 August has to be run on a report.
- Nothing drills down. Slices, bars and points show their value when you hover, and clicking one opens nothing.
- No filters. The screen has no filter panel, so figures cover the whole property. Room type, rate plan and source breakdowns live on the reports.
- It is not a forecast. Forward periods count what is on the books today, which moves every time somebody books or cancels.