Occupancy, average daily rate and revenue per available room are the three figures every hotel is compared on, and they are one number cut three ways. RevPAR is ADR multiplied by occupancy. Anything you do to one of the first two shows up in the third, which is why RevPAR is the one to judge a decision by: dropping your rate until the house is full moves occupancy and ADR in opposite directions, and only RevPAR tells you whether the trade was worth making.
Three reports, one number
| Report | Answers | Grouped by |
|---|---|---|
| Occupancy Report | How full were we, and how does that compare with last year | Period, one section per year |
| Average Daily Rate (ADR) | What did the rooms we sold go for | Period, this year only |
| RevPAR Report | Which room types earn their share of the building | Room type |
Day, week or month

Occupancy and ADR carry a period switch that nothing else in Reports has. It asks the server for a different grouping rather than rearranging what is already on screen, so the whole report reloads and the row count changes with it. Month is the default and the one to compare years on; day is the one for reading a single week's trading; week sits between the two and is the least used.
The RevPAR report has no switch, because it groups by room type rather than by period.
Occupancy: two years on one axis
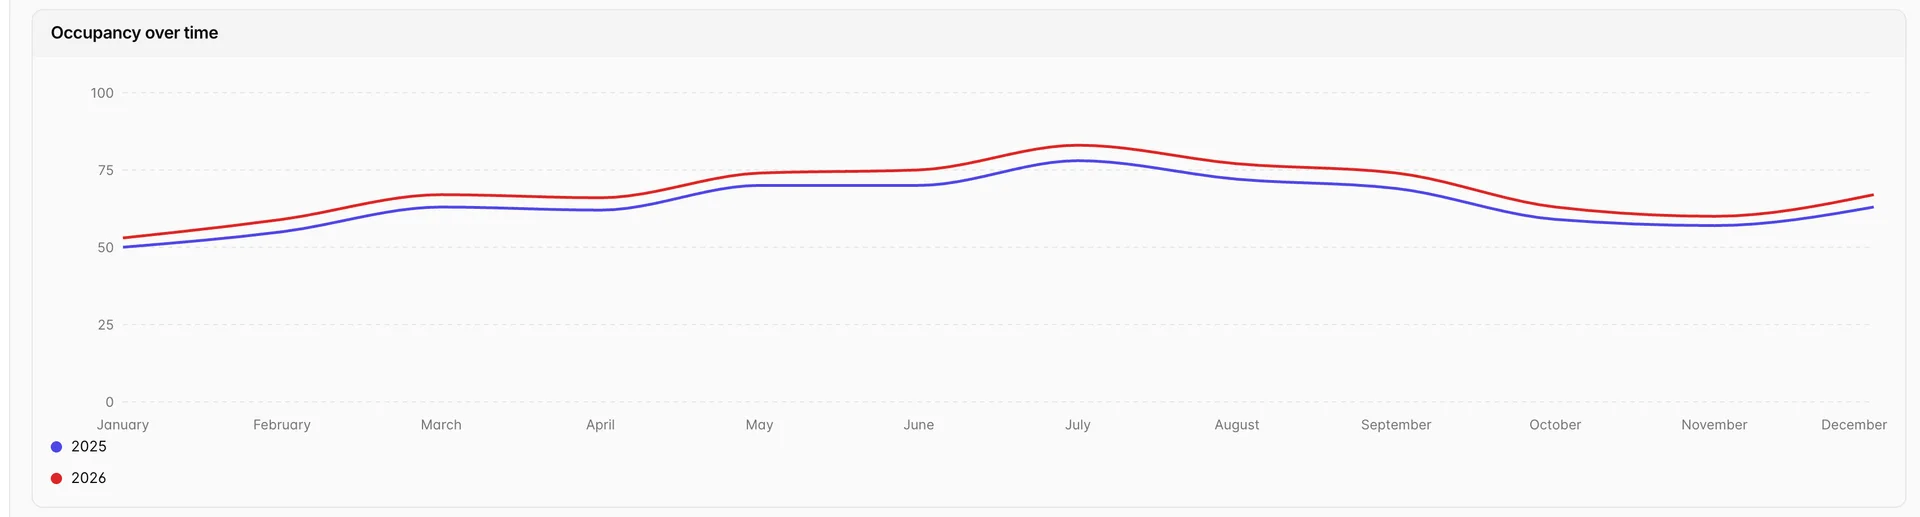
The chart draws one line per year over the same twelve months, which is the only place in Reports you get a year on year comparison without running the report twice. Read the gap rather than the shape: every hotel's shape is its season, and the useful question is whether this year sits above or below last year in the months you were trying to fix.
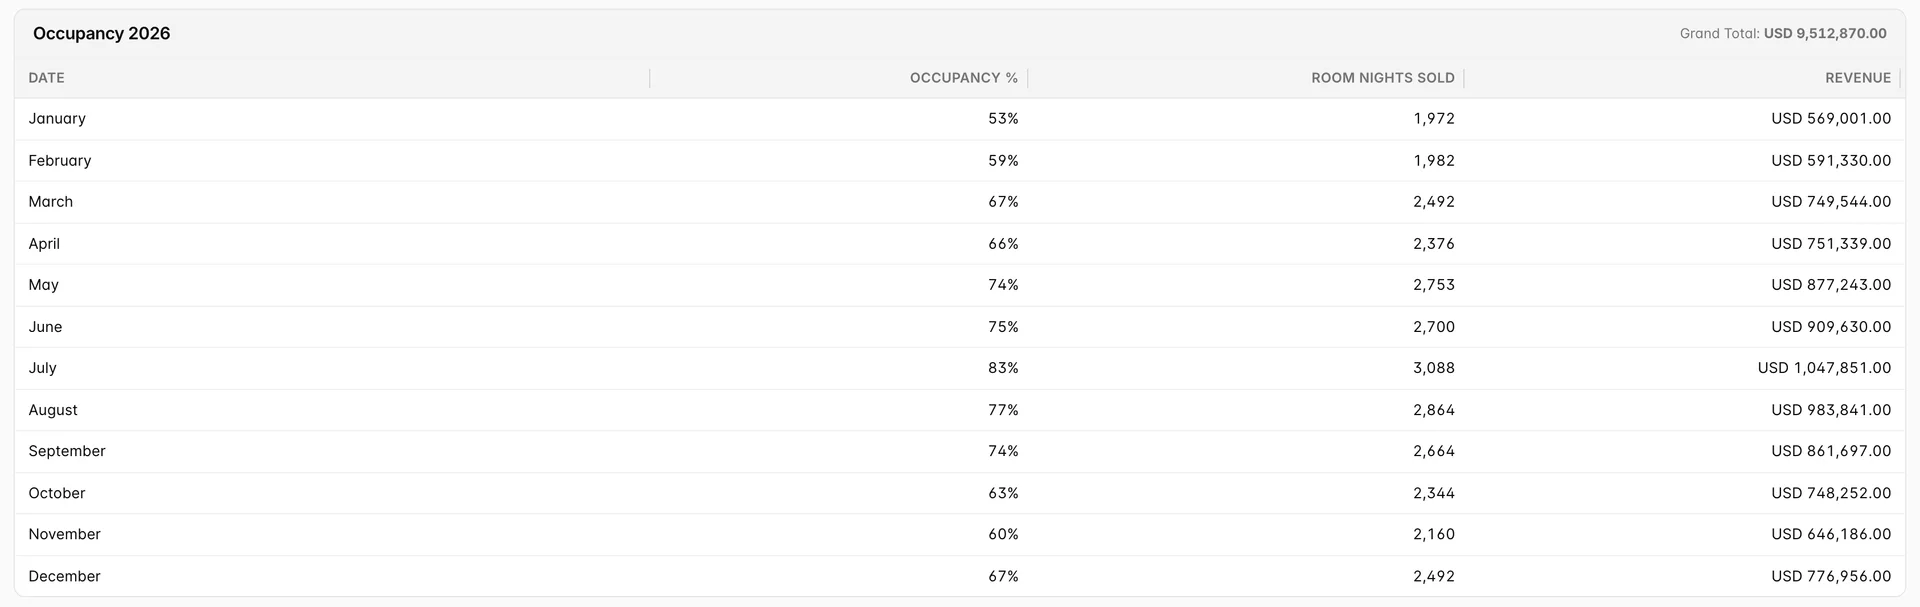
Below the chart, one section per year. Occupancy % is room nights sold against room nights available, so a month at 83 percent means 17 percent of the building went unsold that month and cannot be sold again. Room Nights Sold is the same fact as a count, and Revenue is what those nights earned.
ADR: what the sold rooms went for
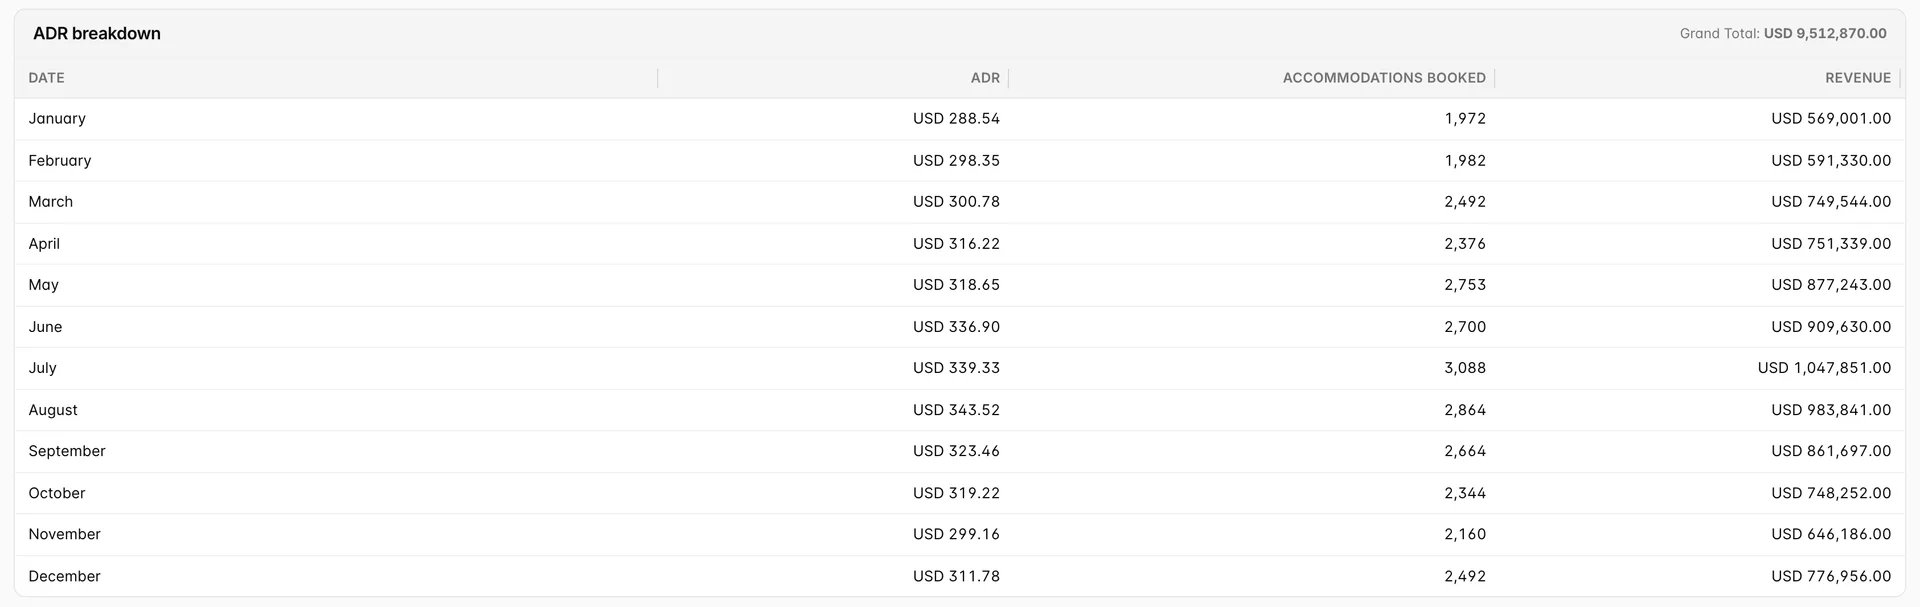
ADR is room revenue divided by rooms sold. It says nothing about the rooms you did not sell, which is both its use and its danger: a hotel that sells four suites at a high rate and nothing else posts a wonderful ADR and an awful month.
Accommodations Booked is the same room night count the occupancy report calls Room Nights Sold, and the Revenue column is the same money. Over the same range, this report's grand total and the occupancy report's total for the current year are the same figure, which is the quickest way to confirm both are answering for the same population.
RevPAR: which room types earn their floor space

RevPAR divides room revenue by every room you have, sold or not, so it cannot be flattered by leaving rooms empty. On this table it is reported per room type, which turns it into an inventory question: a type with a high ADR and a low occupancy can easily earn less per room than a cheaper type that sells out.
The arithmetic is visible in each row. ADR times occupancy is RevPAR, and RevPAR times Total Rooms times the days in the range is Total Revenue. If a row does not multiply out, the range or the filters have moved between the chart and the table.
Making the three agree
The three reports open on different windows, so before comparing any two of them, set the ranges to match. Occupancy and ADR open on the last two months, and RevPAR on the last month.
All three panels carry the same three switches, and they decide who is counted: Include Cancelled Bookings, Exclude Complimentary Rooms and Exclude House Use. House use is excluded by default on all three, which is what you want, since a room your own staff occupied was never available to sell. The three do not agree on cancellations, though, and that is the likeliest reason two of these reports will not reconcile: ADR opens counting cancelled bookings and the other two open ignoring them. Set that switch the same way on both reports before you conclude the figures disagree. The RevPAR panel adds Include Taxes / Service Charges, so a RevPAR that will not reconcile with the other two is worth checking that switch for. Each panel remembers its own settings, and nothing applies until you press Save Changes.
What these reports will not do
- RevPAR has no export and no period view. Occupancy and ADR offer Export as PDF and Export as Excel; RevPAR offers neither, and cannot be trended by month.
- An export is the figures on screen, not the whole report. Both files are built from the rows and the range you are looking at, so set the filters before exporting rather than after.
- ADR shows the current year only. The occupancy report is the only one of the three that draws two years, so year on year rate comparison means running ADR twice.
- No sorting. Column headings are not clickable on any of the three.
- Neither figure is forward looking. These are reports on trading, not forecasts. For rooms on the books ahead of today, use the calendar or the daily reports.