Prostay ships thirty reports, and they are built from a handful of shared parts. The same search box finds all of them, the same page header sits at the top of nearly every one, and the same filter panel slides in from the right when you press Search filters. This article covers those shared parts. The other articles in this section cover what each report actually answers.
The Reports Dashboard
The dashboard is a launcher, not a report. It holds every report in the property management system on one screen, grouped into five categories, and it is the only screen that lists them all.
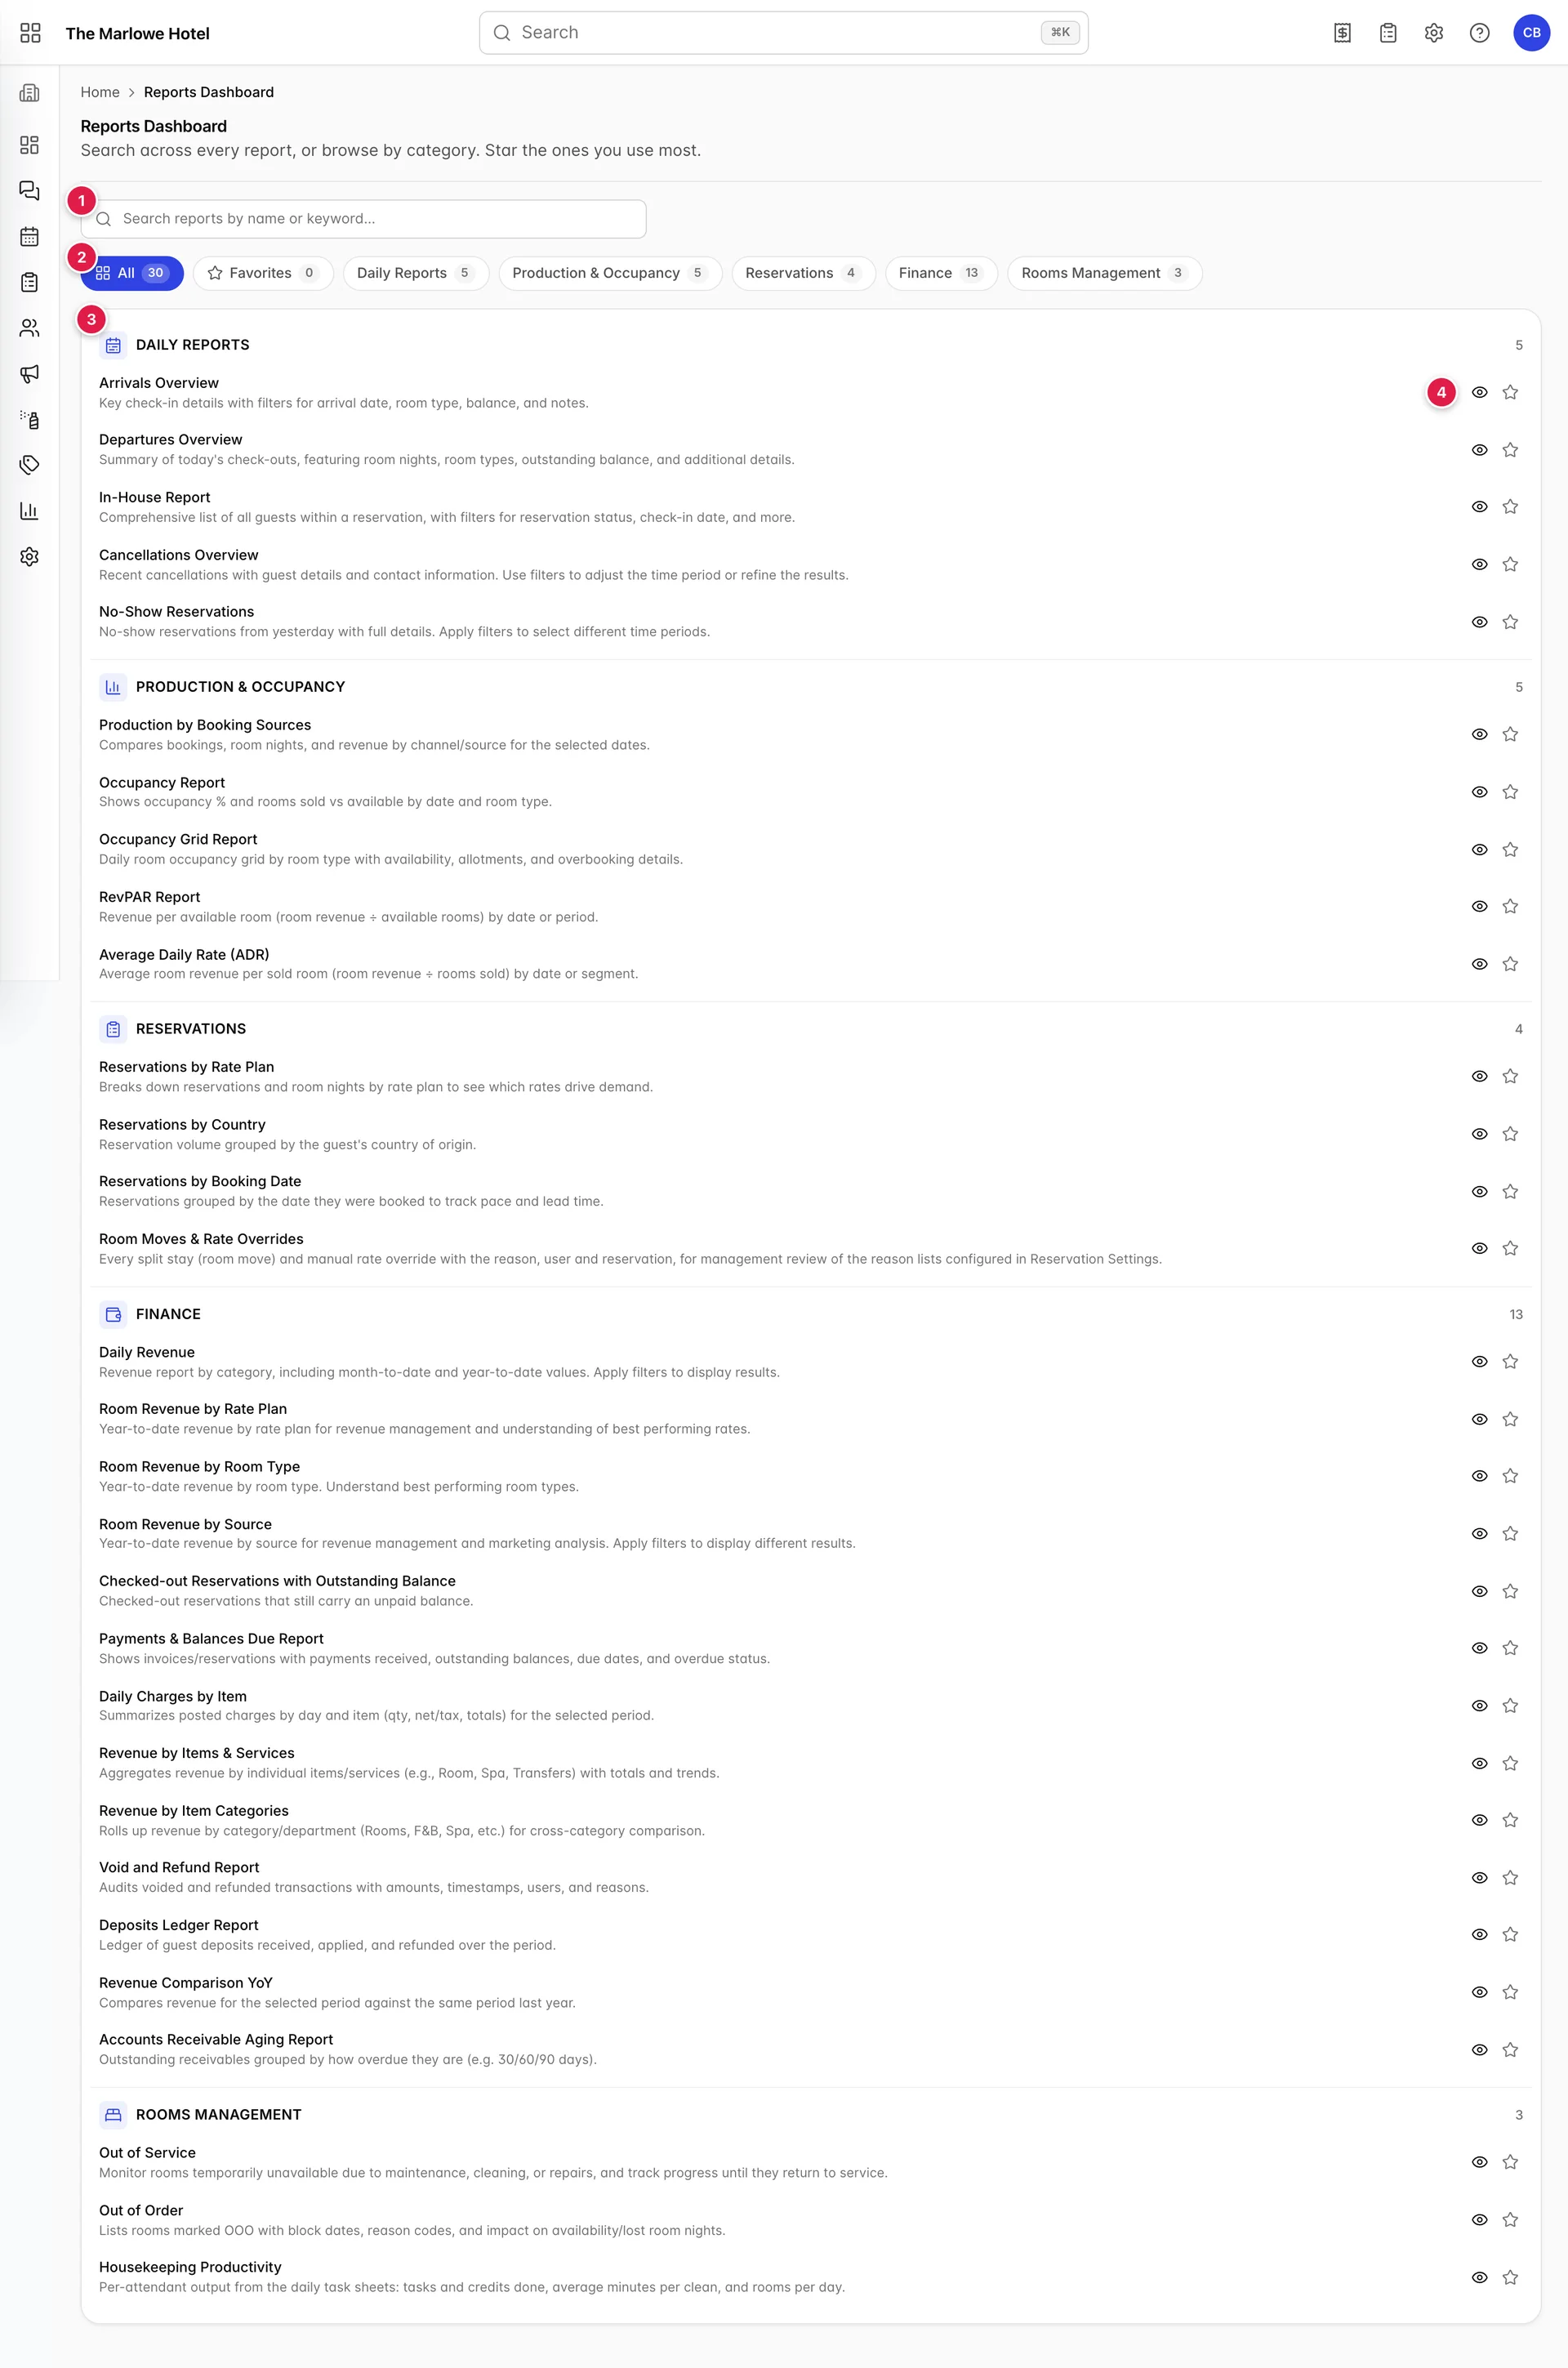
- The search box. Matches on the report name and on the grey description under it.
- The category chips. All, Favorites, then one chip per category. The number on each chip is how many reports it holds, so the five category chips always add up to the number on All.
- A category heading. Five of them, in a fixed order: Daily Reports, Production & Occupancy, Reservations, Finance and Rooms Management. Finance is the biggest by a distance, with thirteen.
- The row actions. An eye that opens the report and a star that pins it to Favorites.
Finding one report

Typing anything into the box changes the shape of the list. The five category headings collapse into a single ranked list with a count at the top of it, every row gains a grey category label on the right, and the text you typed is highlighted wherever it was found.
Search looks in two places: the report name and its description. That is why deposit finds both the Deposits Ledger Report by name and other reports that only mention deposits in their description. Results are ordered by how well they matched: names that start with what you typed come first, then names that contain it, then description-only matches, and alphabetically within each of those.
- Press Enter when one report is left and it opens. With two or more matches, Enter does nothing.
- Press Esc, or use the small cross at the right of the box, to clear the search.
- Chips and search stack. Pick Finance and type revenue and you get the finance reports mentioning revenue, not all of them.
When nothing matches you get No reports found and a prompt to try a different keyword. The Favorites chip has its own empty state, No favorites yet, which is what you see until you star something.
Starring the ones you use

A row holds the report name, a one-line description of what it answers, an eye and a star. Clicking anywhere on the row opens the report, and so does the eye; the row is also reachable from the keyboard, where Enter or the space bar opens it. Only the star behaves differently, and it does not open anything.
Starring a report saves it against your user account rather than against the browser, so your list of favourites follows you to any machine you sign in on, and the person on the next shift keeps their own. The count on the Favorites chip goes up as you star, and the chip shows exactly those reports.
The Daily Reports hub
The five daily reports have a second front door at Reports › Daily Reports, and it behaves differently from the dashboard in one way that matters.
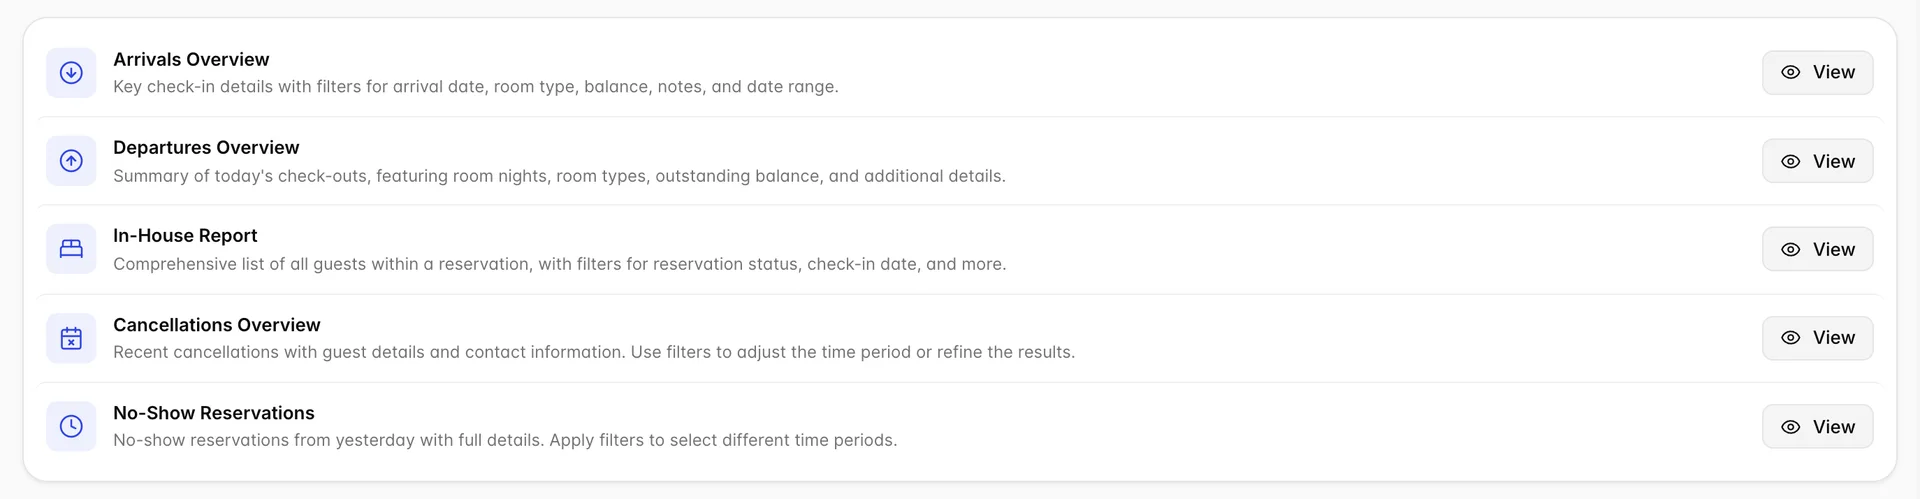
View here does not open the report. It opens that report's filter panel on top of the hub, so you choose your dates first and land on a report that already shows what you asked for. Opening the same report from the Reports Dashboard skips that step and goes straight to the table, using whatever filters were last applied.
What every report looks like

- Search filters opens the filter panel on the right. The eight production and reservations analytics reports label the same button Filter Report; it behaves identically.
- Export builds a printable copy of the rows currently on screen. On the analytics reports it is a menu offering Export as PDF and Export as Excel rather than a single button. See Export below before you rely on it.
A few reports put one more control in front of those two. Occupancy Report and Average Daily Rate (ADR) carry a Day / Week / Month switch that regroups the rows without reopening the filter panel.
Above the toolbar sit the breadcrumbs, which are the fastest way back: the Reports crumb returns you to the dashboard from any report. Below the title, one line of grey text says what the report counts. It is worth reading, because several reports have similar names and different definitions.
While a report loads, a spinner covers the page. It clears when the rows arrive, and an empty report shows a short message with a Search filters button in the middle of the screen rather than an empty table.
The filter panel
Press Search filters and a panel slides in from the right. Every report has its own set of controls, but they follow the same pattern, and this one from Arrival Overview is the busiest of the daily reports.
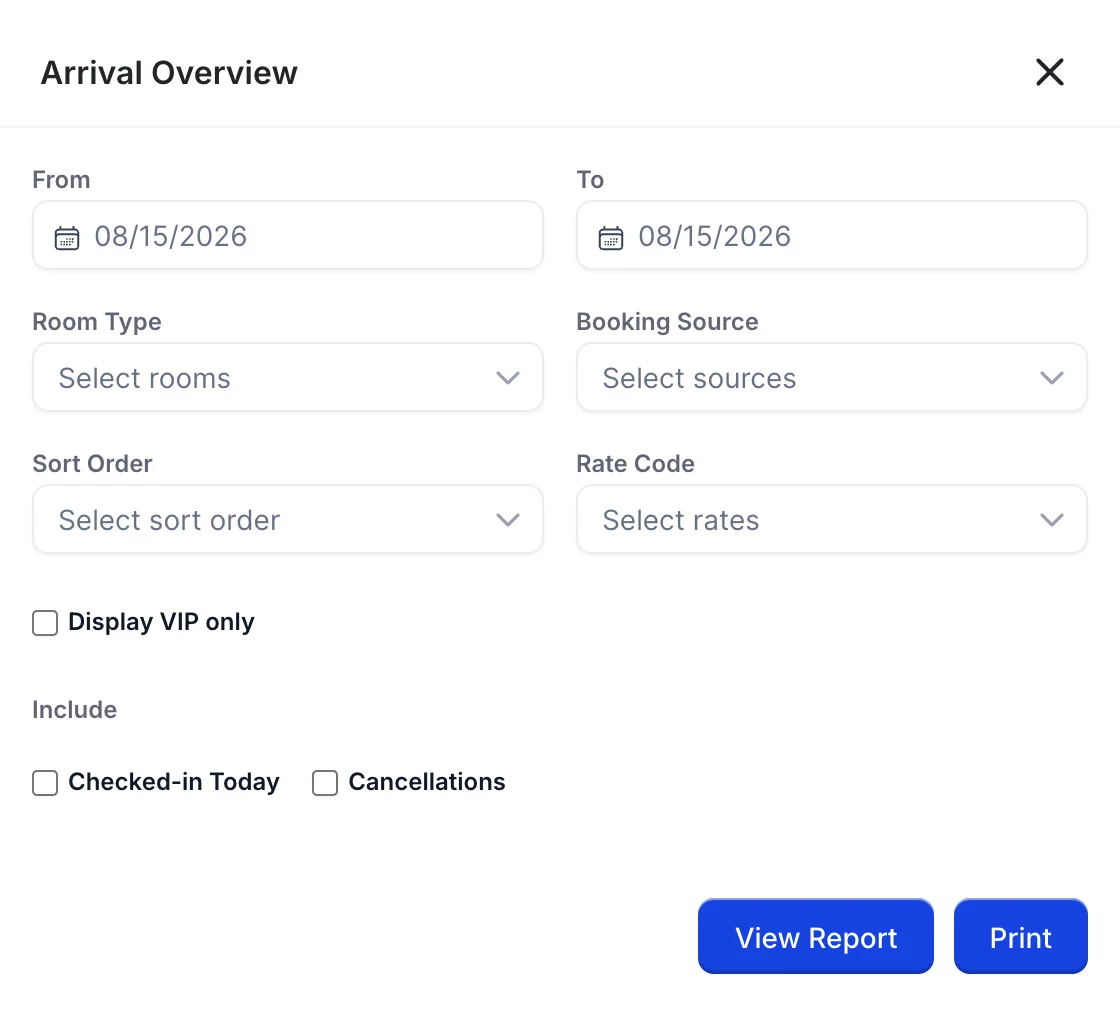
| Control | What it does |
|---|---|
| From and To | The date range the report covers, both set to today the first time you open it. Which date they test depends on the report: arrival date on Arrivals, departure date on Departures, cancellation date on Cancellations. Set them to the same day for a single day's list. |
| Room Type | Ticks off accommodation types, with a Select all at the top. Leaving it empty means every type, which is not the same as ticking all six: ticking them all and then adding a type to the property later leaves that new type out of your saved filter. |
| Booking Source | The channels the booking came through, plus Booking Engine for anything sold on your own site. Use it to answer questions about one channel without leaving the report. |
| Sort Order | Orders the rows inside each date group by Room no., Guest Name, Room Nights, Paid Amount or Departure Date. The options are drawn as checkboxes but only one applies: ticking a second replaces the first, and ticking the current one clears it. |
| Rate Code | Narrows to bookings sold on particular rates. The list holds your rate plans and your base rate intervals together, so it is longer than the rate plan list you see elsewhere. |
| Display VIP only | Keeps only guests flagged VIP on their profile. On a busy arrivals day this is the fastest way to get the list the duty manager actually needs. |
| Include | Adds rows the report leaves out by default. Cancellations brings in bookings that were cancelled for those dates, which are otherwise hidden so that nobody holds a room for a guest who is not coming. Checked-in Today keeps guests who have already arrived, so the list does not shrink as the desk works through it. |
- Press Search filters.
- Set the controls you need. Nothing on the report changes yet.
- Press View Report. The panel closes and the table reloads.
Section headings and their counts
Reports that cover more than one day break the table into one section per day rather than running everything together.

The figures on the right belong to that section alone. Seven reservations and twenty-one room nights means seven bookings arriving on that date, staying twenty-one nights between them. Widen the date range and you get more sections, each with its own pair of figures, and no grand total at the foot. If you need the total across a range, add the sections up, or use one of the production reports, which aggregate by design.
Export
Export on the toolbar and Print in the filter panel do the same thing: they send the rows you are looking at to the report service, which returns a PDF and opens it in a new tab ready to print. Allow pop-ups for Prostay or the tab is blocked and nothing appears.
Things that catch people out
- A failed report looks like an empty one. When a report cannot reach the server it shows the same empty state as a report with no matching rows. If a report you know has data comes back empty, reload the page before you go hunting through the filters. This matters most on Performance Center and House Status, which load in several pieces: one piece can fail while the rest of the page looks perfectly normal.
- Some reports look older than others. The six Daily Revenue breakdowns, In-House Guest and Checked-out Reservations with Outstanding Balance have not been rebuilt on the current design yet, so they have different buttons and tables from the screenshots above. The contents are current; only the styling is behind.
- Dates and money follow the property. Every report formats dates and currency from your property's general settings, so a report shows 08/15/2026 or 15/08/2026 depending on what is set there, not on where you are sitting.
- Reports can be locked down one at a time. Access is granted per report, so a role can be allowed the Arrivals Overview and refused the finance reports. A report you cannot see is not missing; ask whoever manages your roles, who grants it through report groups.