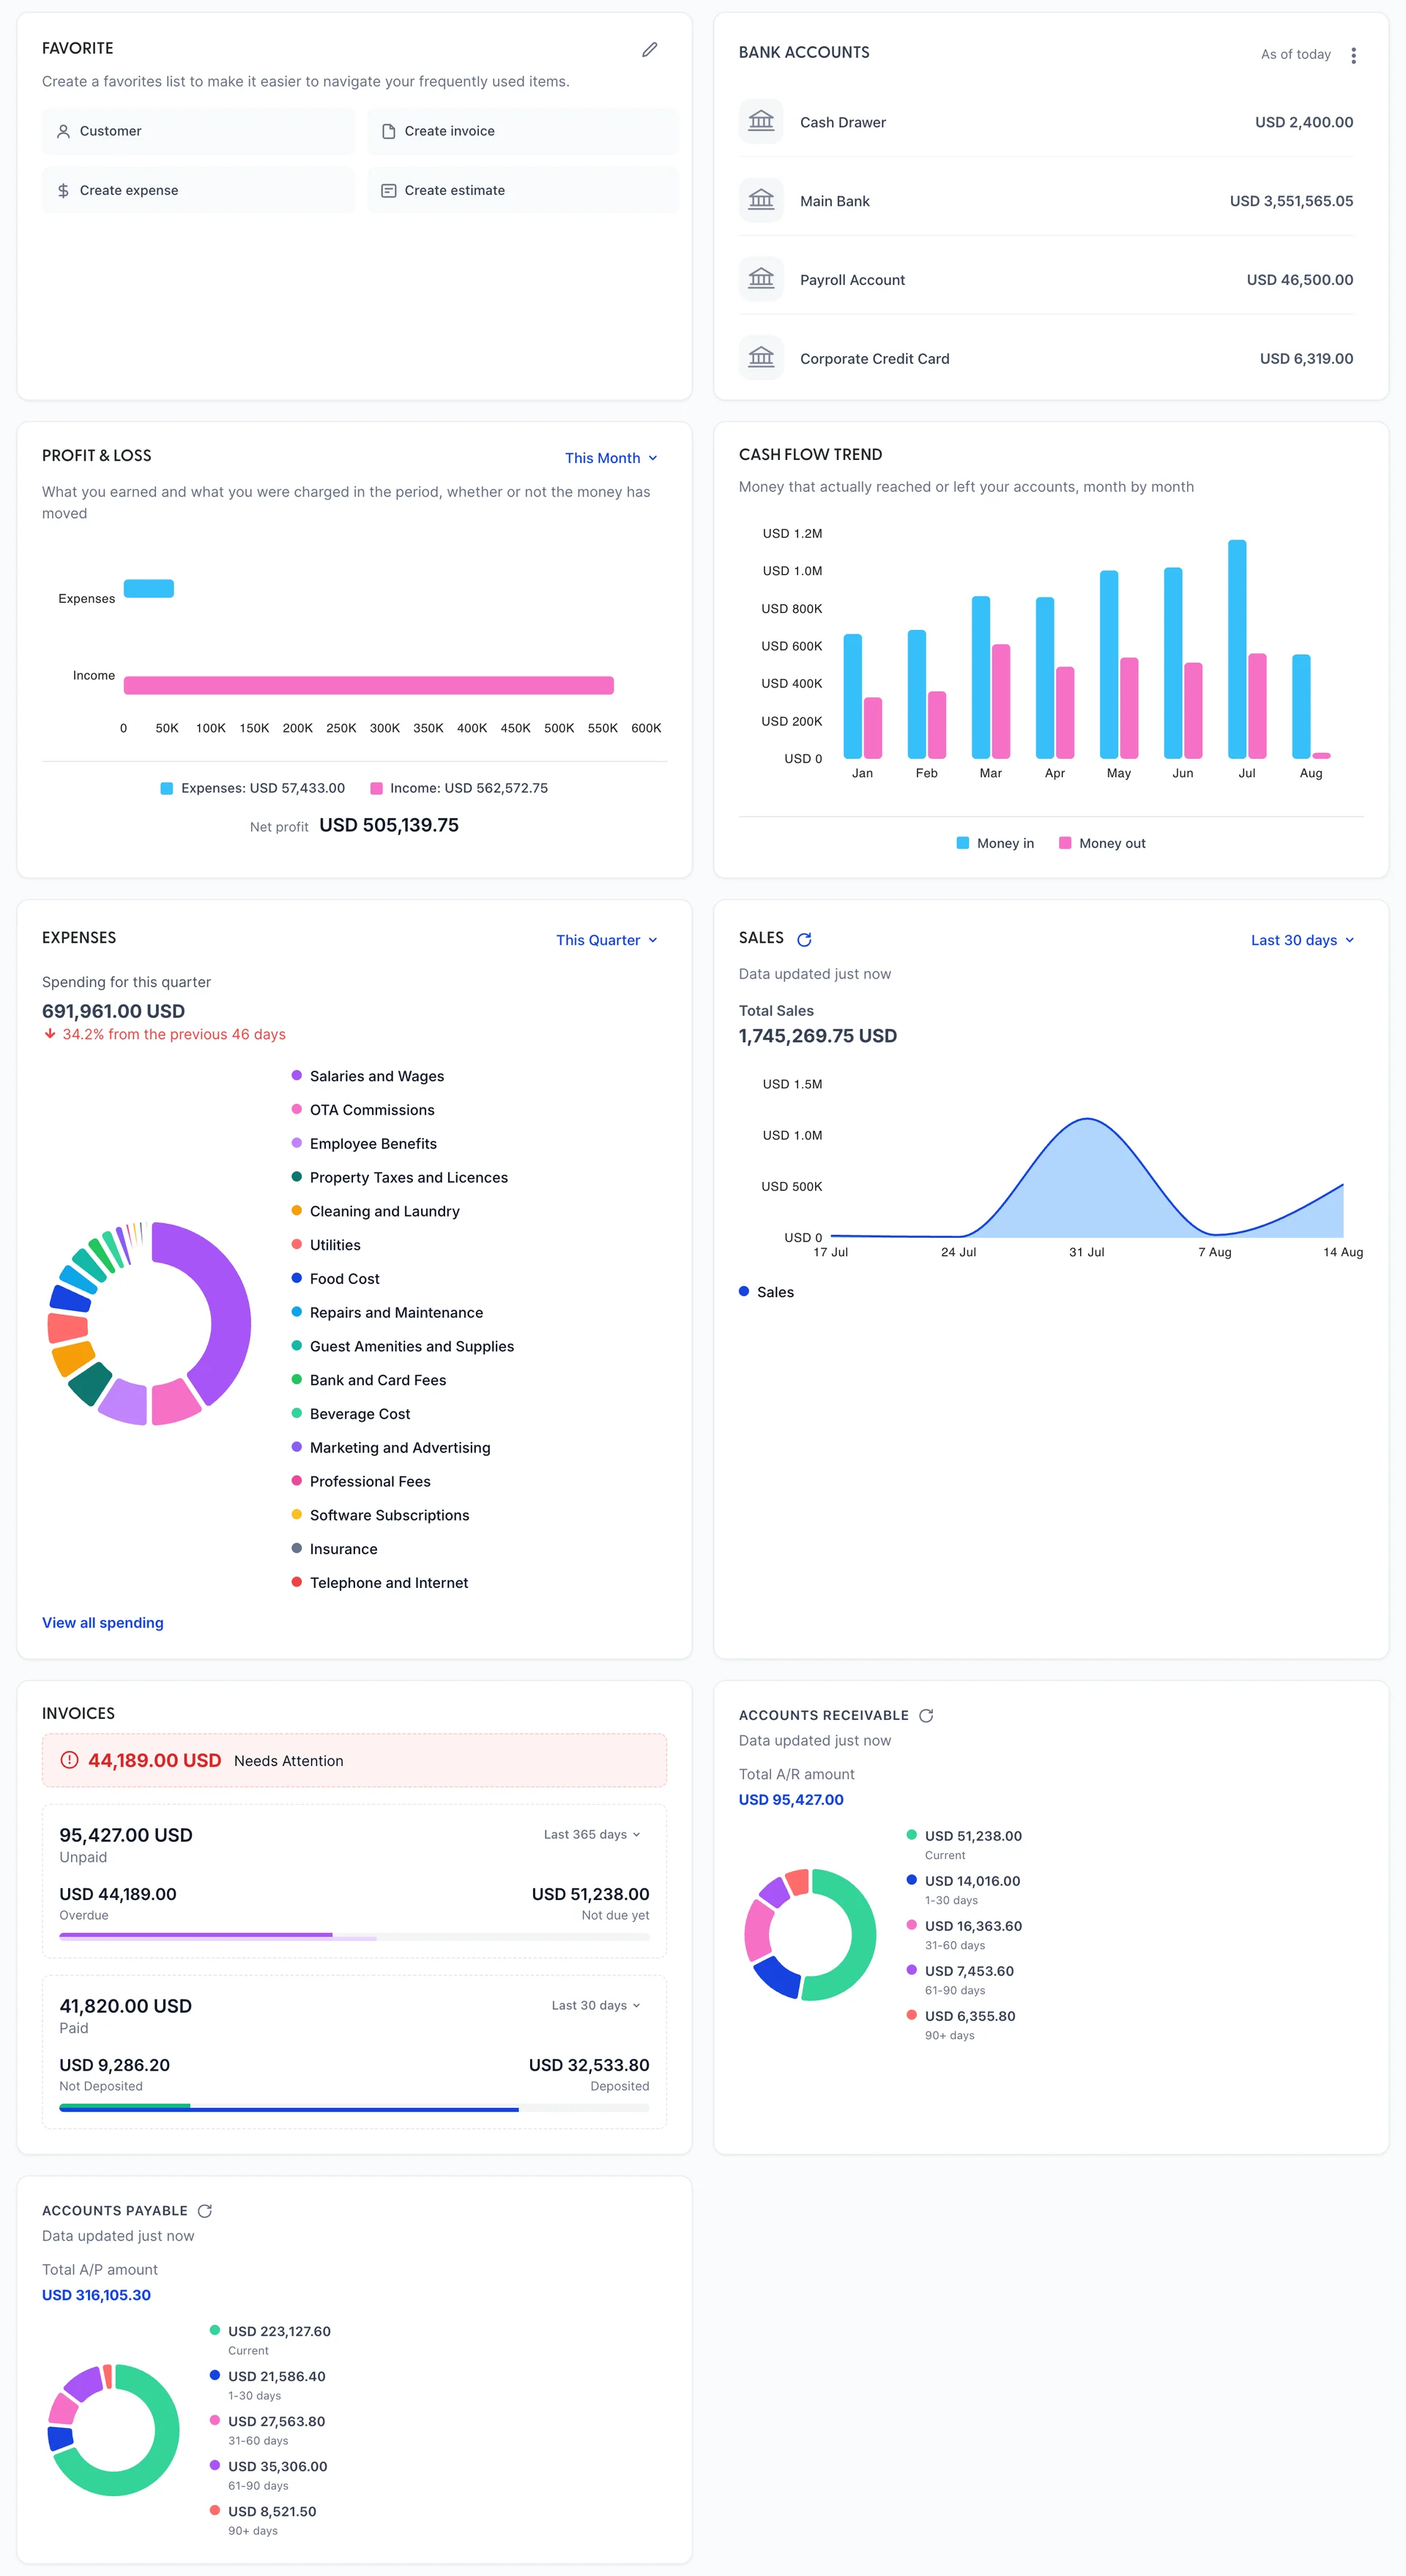
The dashboard is the first screen in Prostay Accounting and the only one that summarises rather than lists. Nine panels, each one adding up documents you can open somewhere else. Nothing here is typed in: every figure is the arithmetic of invoices, bills, expenses and payments recorded elsewhere in the module, which is why a figure that looks wrong is usually a document that is wrong.
What the dashboard is
It is a summary of this module and nothing else. Room revenue, folio charges and channel bookings do not arrive here on their own, so the dashboard describes the books rather than the hotel. If the two disagree, see how the module fits together before you go looking for a bug.
Every panel is read-only. There is nothing to save, nothing to configure except the favourites card at the top left, and no way to move a panel or hide one.
Five period pickers, and none of them agree
This is the thing to know before you read a single figure. Four panels carry a time frame control and the Invoices panel carries two, making five in all. They do not follow each other, they do not start on the same window, and they do not even offer the same list of windows.
| Picker | Starts on | What it offers |
|---|---|---|
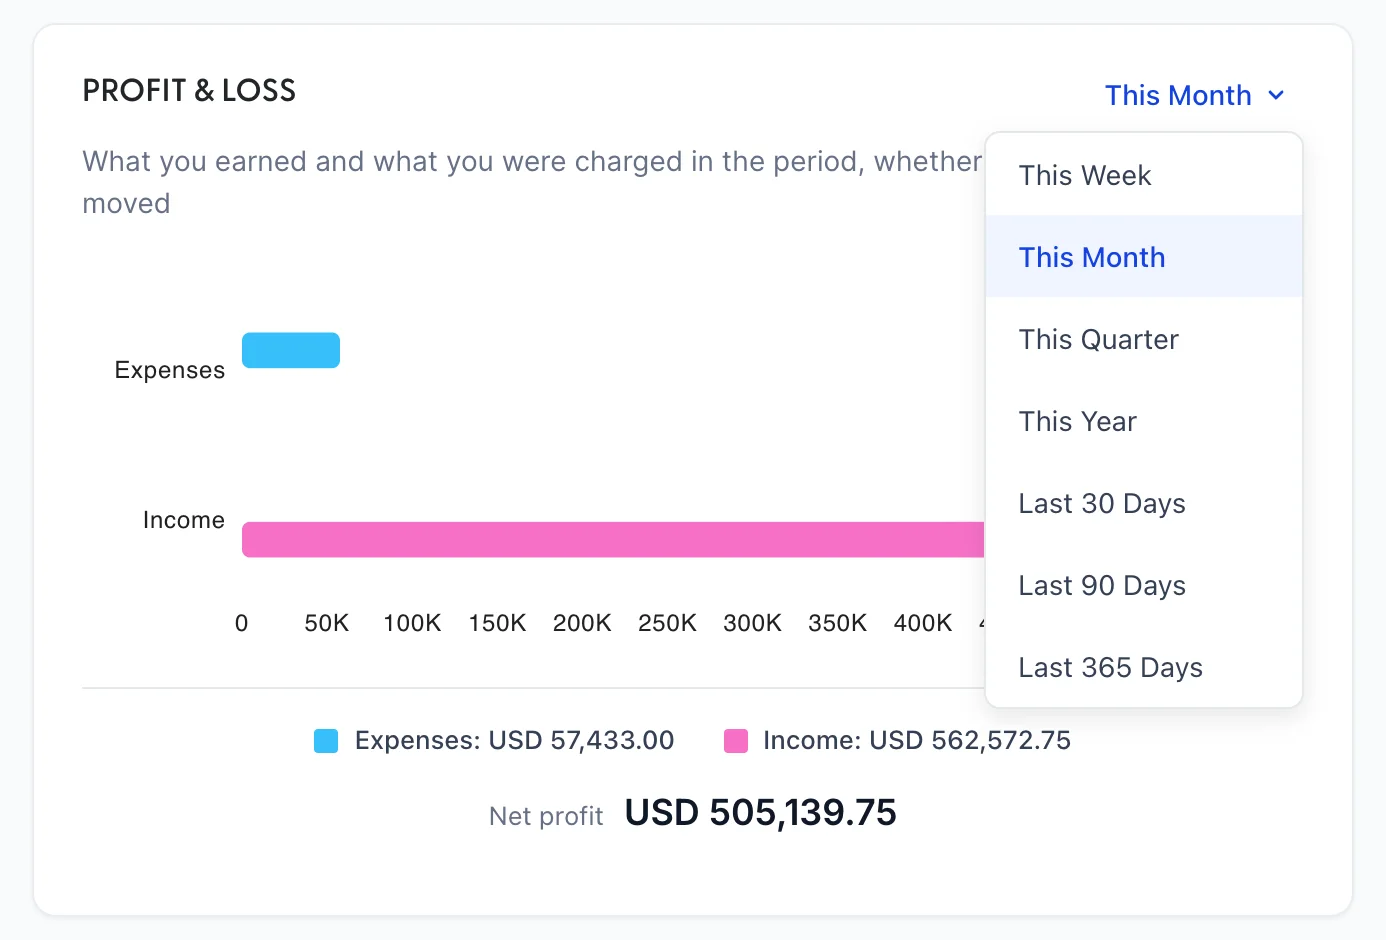
| Profit & Loss | This Month | This Week, This Month, This Quarter, This Year, Last 30 Days, Last 90 Days, Last 365 Days. |
| Expenses | This Quarter | This Week, This Month, This Quarter, This Year and Last fiscal quarter, which is the only complete period any picker offers. |
| Sales | Last 30 days | Seven options, including Last 7 days, which no other panel has. |
| Invoices, unpaid | Last 365 days | Six options. Dates the invoice, not the payment. |
| Invoices, paid | Last 30 days | The same six. Dates the payment, not the invoice. |
The dashboard opens on four different windows at once
Profit and loss for the month so far, expenses for the quarter so far, sales for the last thirty days, and unpaid invoices for the last year. Comparing the profit figure against the expenses donut is comparing a fortnight against six weeks, and nothing on the screen says so. Set the pickers to match before you draw a conclusion from two panels at once.
Two panels have no picker at all. Cash Flow always draws the last twelve months, or from your first document if that is more recent. The two ageing panels are always as of today, because an ageing bucket in the past would mean almost nothing.
Why a fortnight flatters you
Look at profit and loss for a part month, on any hotel's books, and it will usually be too good. This is worth understanding because the screen gives no hint of it.
Income tends to be recognised in large, regular lumps: a month's trading posted in one go, an agency invoiced monthly, a block booking invoiced on arrival. Costs are not so tidy. Wages, rent, the OTA commission invoice and most supplier bills land at or near the end of the month. So on the eighteenth you are often looking at a month's income against a fortnight's costs.
On the demo property the effect is stark, because its trading posts as a single sales receipt each month. This Month reads an 89.8 per cent net margin. This Year, where every month is complete but one, reads 46.3 per cent. The second is the truth about the business and the first is an artefact of the calendar.
Three habits deal with it. Read This Year or a complete quarter when you want to know how the business is doing. Use This Month for spotting something unusual rather than for judging performance. And when a part-month figure looks unexpectedly good, check the date rather than celebrating.
Profit and loss
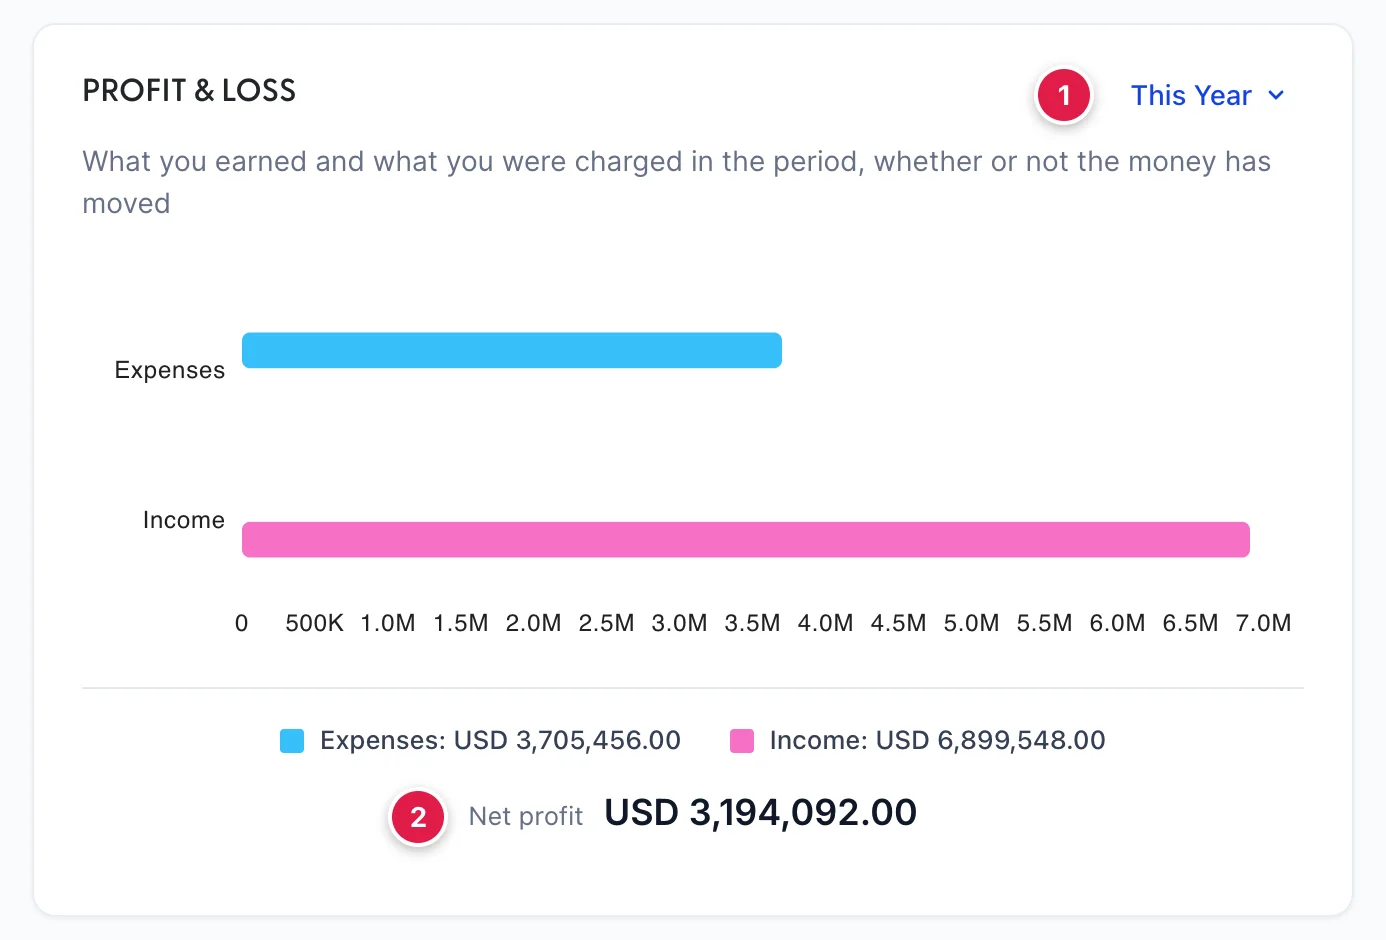
Two bars, two figures under them, and the net of the two below that. Income is what you invoiced or took, before tax, because sales tax you collect is owed to the authority rather than earned. Expenses are what you were charged, whether or not you have paid.
That last point is the one that catches people. A bill you received yesterday and will pay in thirty days is already in the expenses bar. It is not in cash flow, and it will not be until you pay it. The two panels are supposed to disagree.
| Figure | What it counts |
|---|---|
| Income | Invoices and sales receipts dated in the period, before tax, less any credit notes and refund receipts dated in it. An estimate or a sales order is not income until it becomes one of those. |
| Expenses | Every line on a bill, expense, cheque or card charge that was posted to an expense or cost of sales account, less supplier credits. Lines posted to an asset account are excluded, which is why buying a dishwasher does not appear here. |
| Net profit | The first less the second, over the same window. A negative reads Net loss. |
Cash flow trend
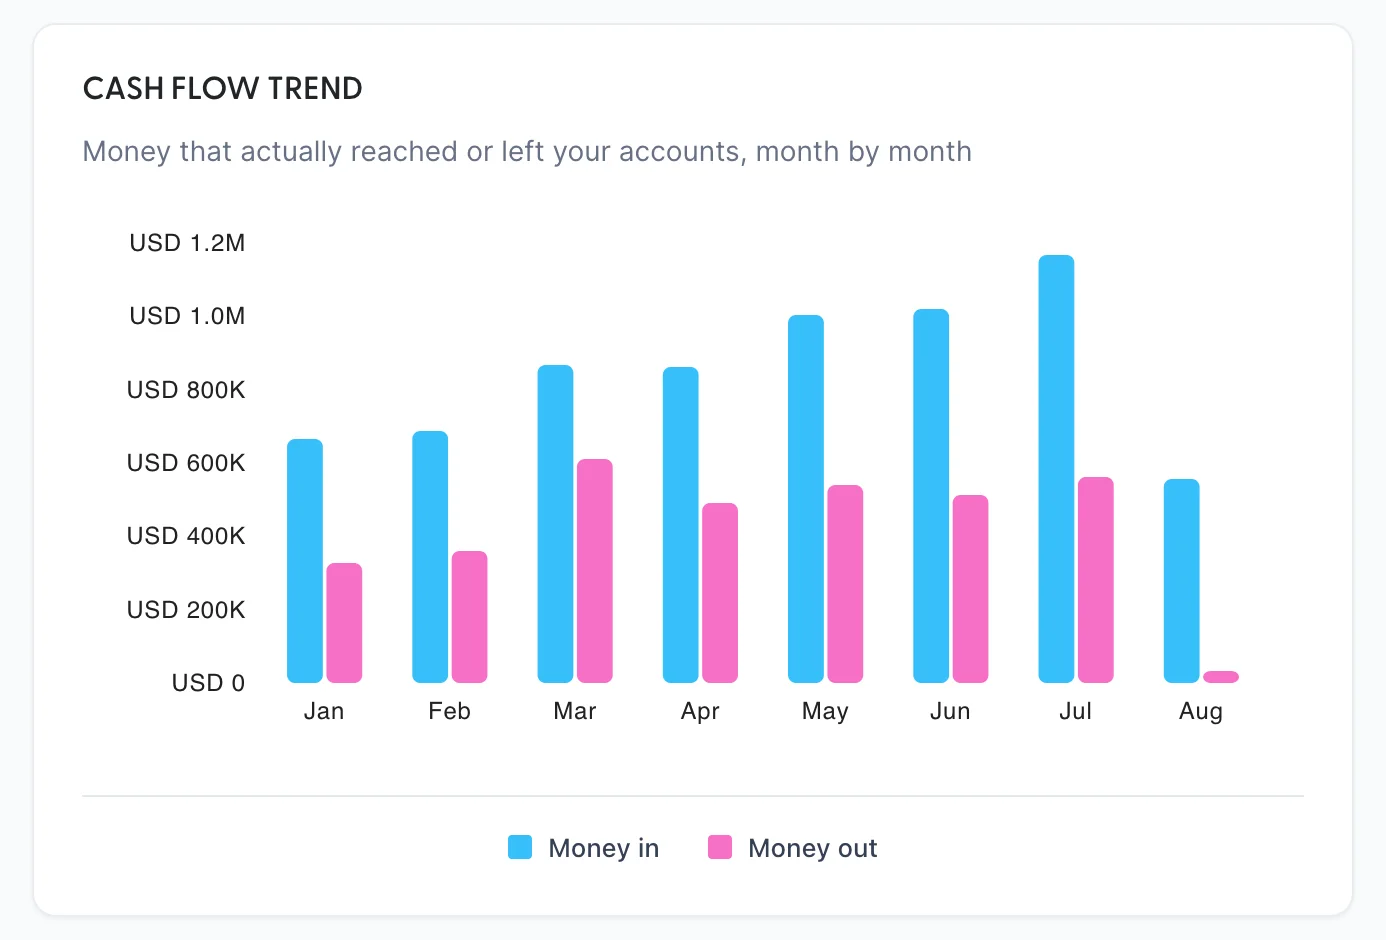
This is the money that actually moved. A payment received puts money in on the day it was received; an invoice does not. An expense or a cheque takes money out on the day it was written, because that is when it was paid. A bill takes money out on the day you settled it in Pay bills, not the day it arrived.
A profitable month with negative cash flow means you have invoiced more than you have collected, or paid down old bills. A loss-making month with positive cash flow usually means the opposite. Neither is a mistake, and a business can go under while every month on the left-hand panel is profitable.
Expenses
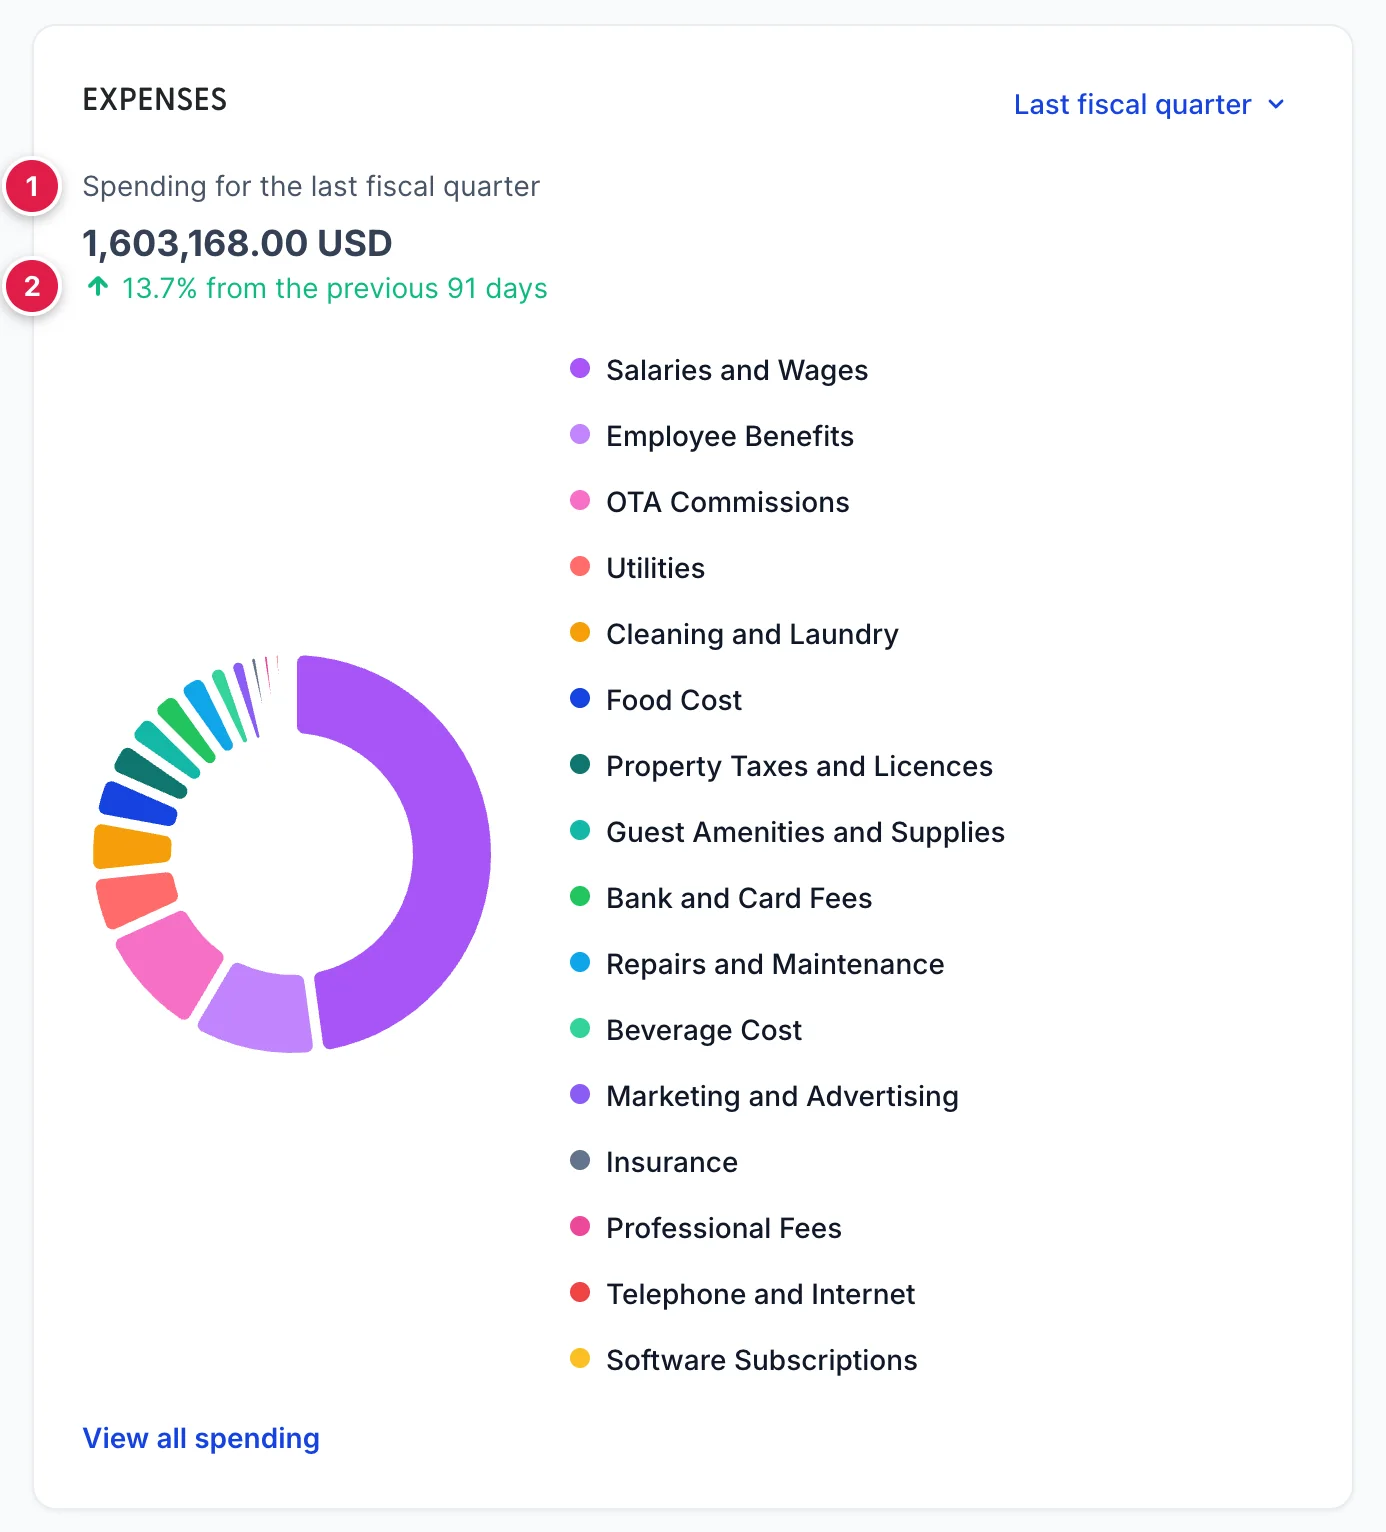
A donut of spending by account for the chosen period, with the total above it and a comparison against the immediately preceding window of the same length. An up arrow means you spent more than last time, which is a red flag dressed in green; read the arrow rather than the colour.
Each slice is one account from your chart of accounts, so how useful this panel is depends entirely on how carefully your spending is coded: a general sundries account large enough to be the biggest slice tells you nothing at all. The legend lists names without amounts, so hover a slice for its figure, or use View all spending to open the list behind it.
Two things are missing on purpose. Anything you bought that was capitalised rather than expensed, such as a vehicle or a refit, went to an asset account and is not here. And a bill you have received but not paid is here in full, because this panel follows the same rule as profit and loss rather than cash flow.
Sales
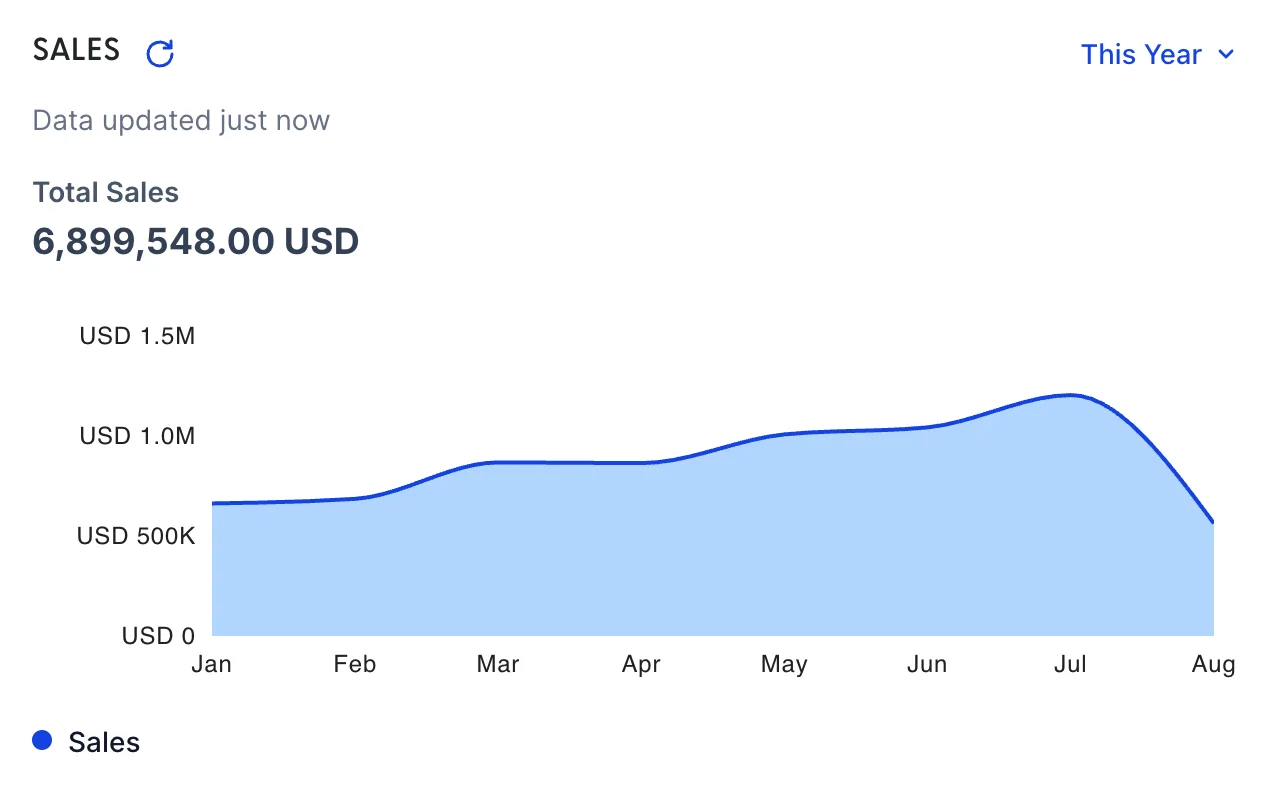
A line of sales over the chosen period with the total above it, and a refresh button beside the heading with a note of when the figures were last read.
The shape of this line depends on how your revenue reaches the books. If you post a month's trading as one sales receipt, the line will step up once a month and sit flat between, which is the workflow showing through rather than a quiet fortnight. If you invoice agencies as they check out, it will be lumpy in a different way. Either way it is a line of what was recorded, not of what the hotel took at the front desk.
Invoices
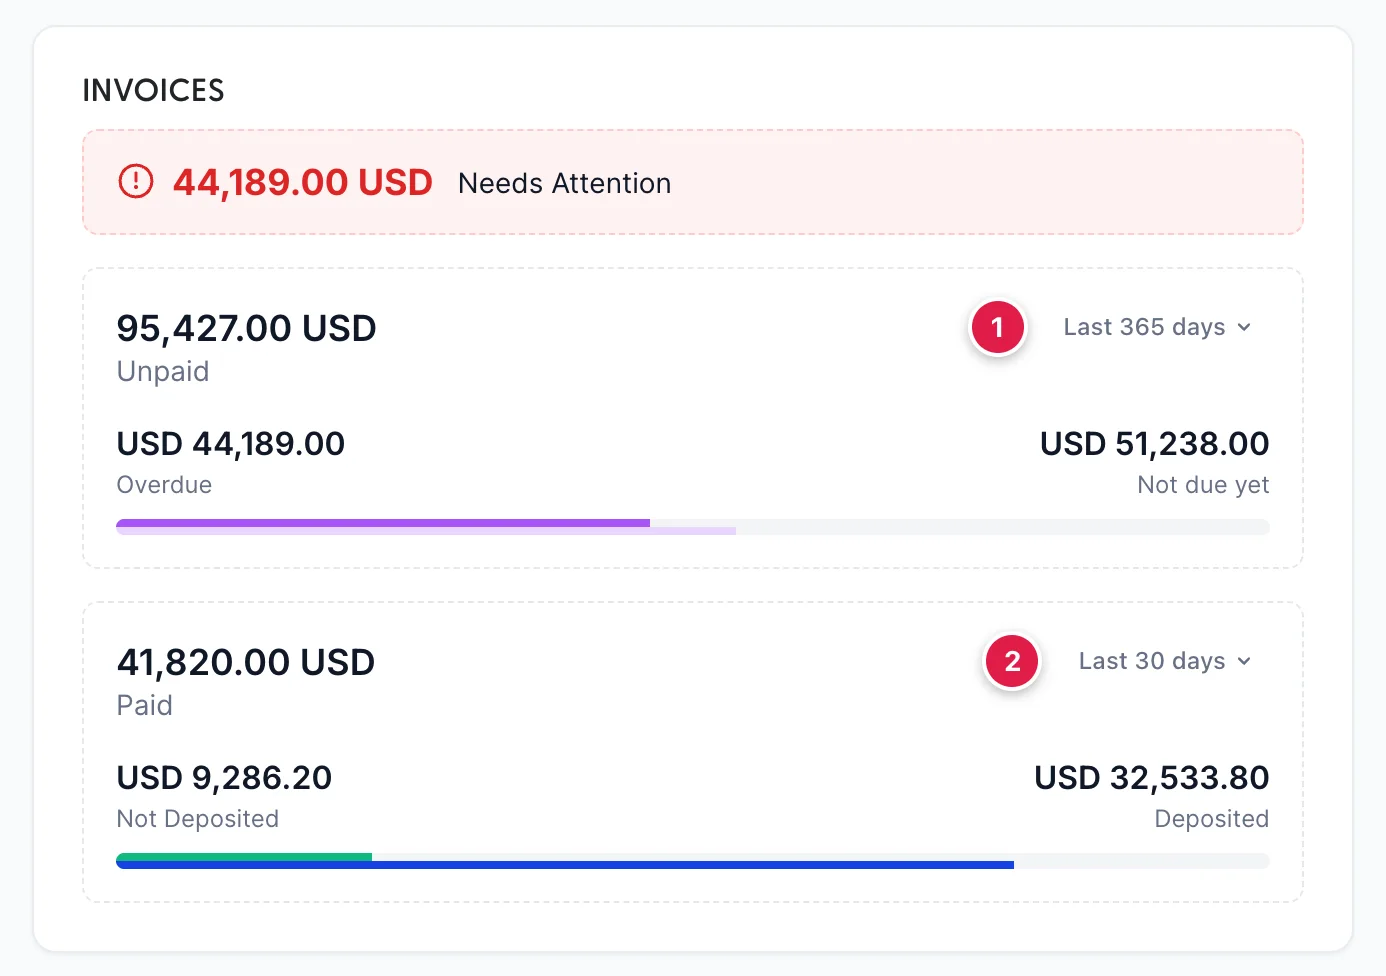
The panel a credit controller wants. Four figures and a warning.
| Figure | What it counts |
|---|---|
| Needs Attention | The overdue total again, in red at the top. It is not a fifth figure. |
| Unpaid | Everything still owed on invoices dated in the unpaid window, split into Overdue and Not due yet by the due date rather than the invoice date. |
| Paid | Payments received in the paid window, which is a different window and dated on the payment rather than the invoice. |
| Not Deposited | Money taken but not yet in the bank: card takings the acquirer has not settled, cheques not banked. It clears itself as the money arrives. |
Because the two halves are dated independently, the paid figure is not the other side of the unpaid one. An invoice raised fourteen months ago and paid last week counts in the paid half and not the unpaid half, on the windows this panel starts with.
What you are owed and what you owe
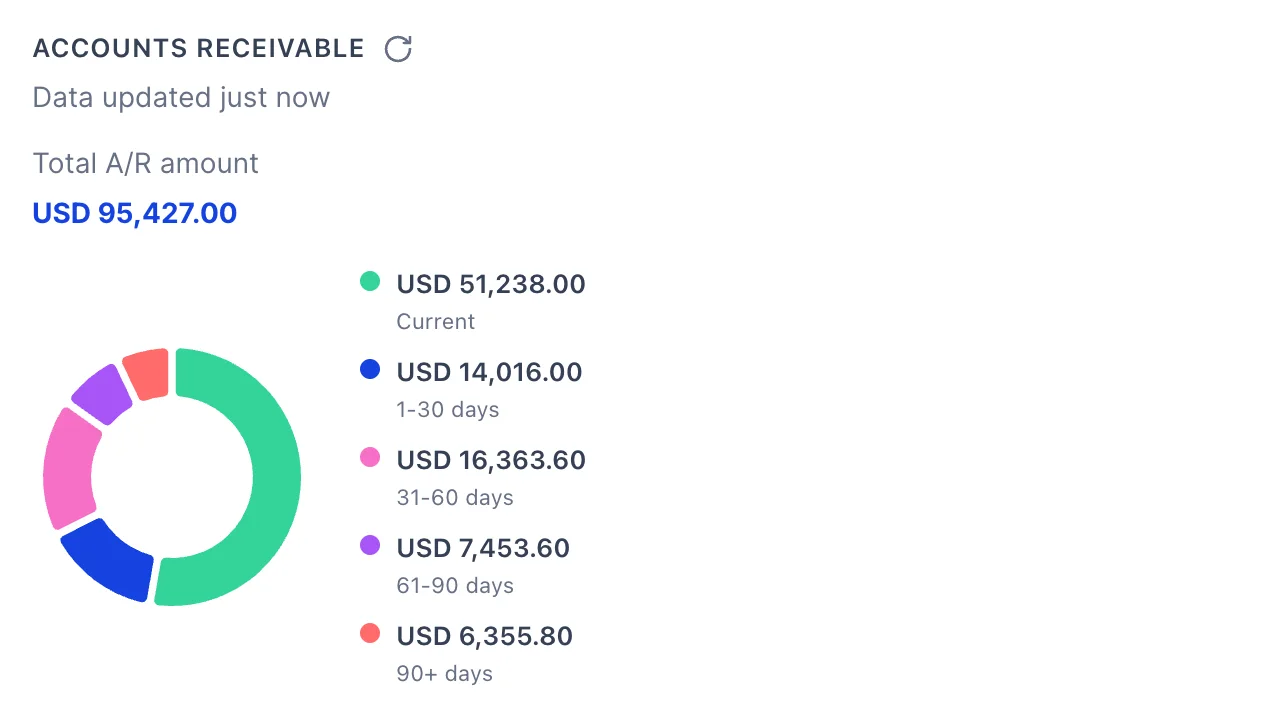
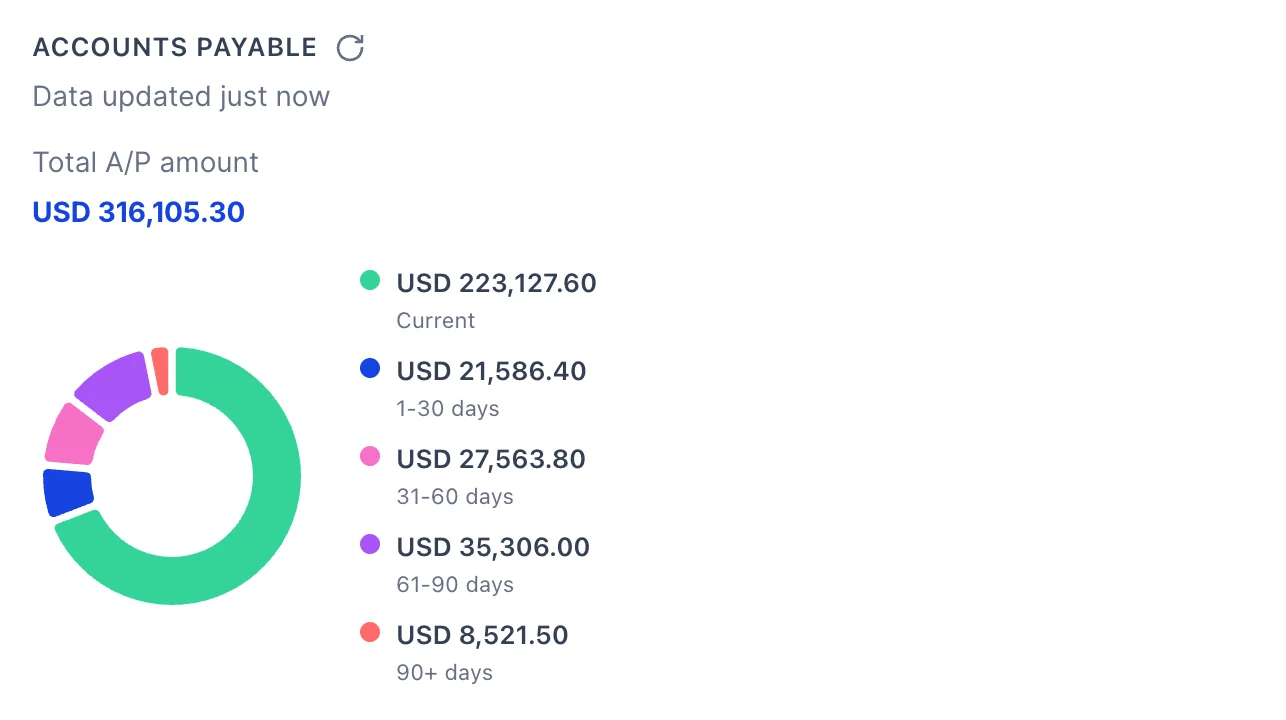
Two donuts in the same five buckets: current, 1 to 30 days, 31 to 60, 61 to 90, and over 90. Receivable is what customers owe you and payable is what you owe suppliers. Both age from the due date, so an invoice with sixty-day terms raised two months ago is current rather than overdue.
Payable counts bills and nothing else, because an expense, a cheque or a card charge was paid at the moment it was recorded and has never been owed. That is the same list you see on Pay bills, which is where the right-hand donut gets shorter.
Read them together rather than one at a time. A large receivable against a larger payable in the same bucket is the shape of a cash squeeze that neither panel shows on its own. Anything over 90 days on the left is worth a phone call today; anything over 90 days on the right is worth an explanation.
Both have a refresh button and print when they last read the figures, since these are the two panels most likely to be left open on a second screen.
Bank accounts
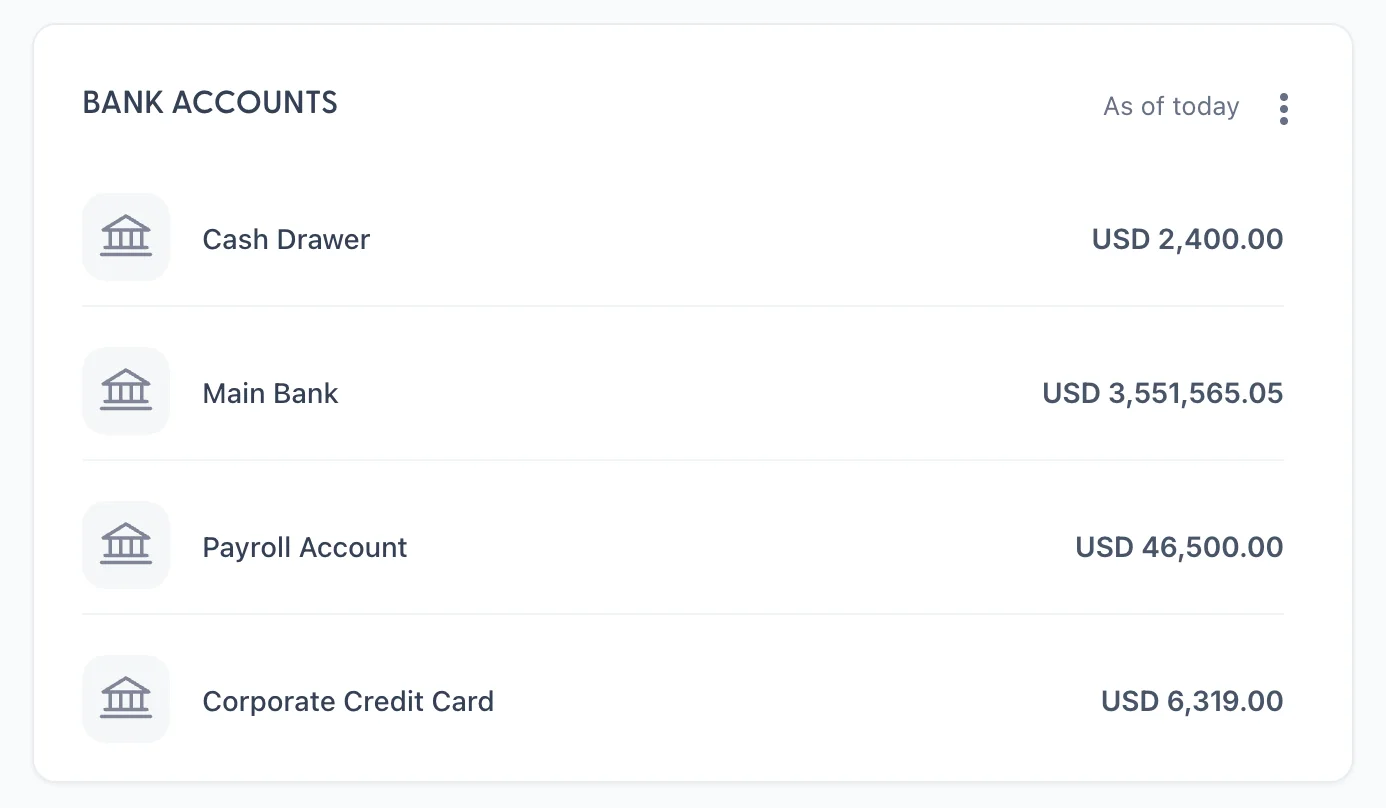
Every account of type Bank or Credit Card on your chart of accounts, with the balance your books say it holds. That is the number to hold on to: this is not a bank feed, and no account here is connected to a bank.
So this panel and your banking app will differ, and the difference is usually legitimate: a cheque written but not presented, a card payment in transit, a fee the bank took that you have not recorded. Reconciling is what turns that difference into either a tick or a missing document, and it is covered in bank rules and reconciliation.
The three dots open Create account, which adds a bank or card account to the chart of accounts with an opening balance. Use the balance on your bank statement on the day you started using Prostay, not today's balance, or every reconciliation afterwards will be out by the difference.
The favourites card
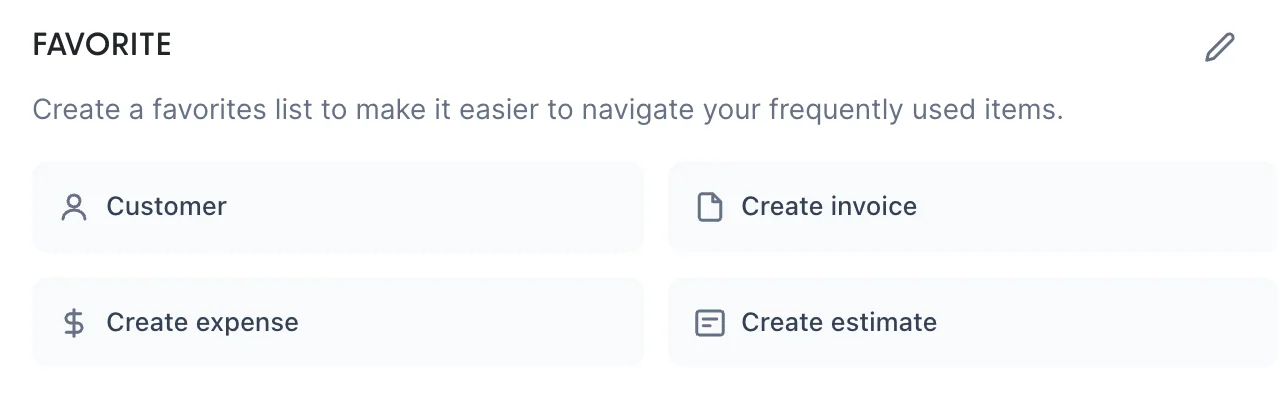
Shortcuts to the forms you use most. Until you choose, it shows the first four of the list below, in a fixed order. Nothing learns from what you click, so if these four are not the ones you use, the card is worth two minutes.
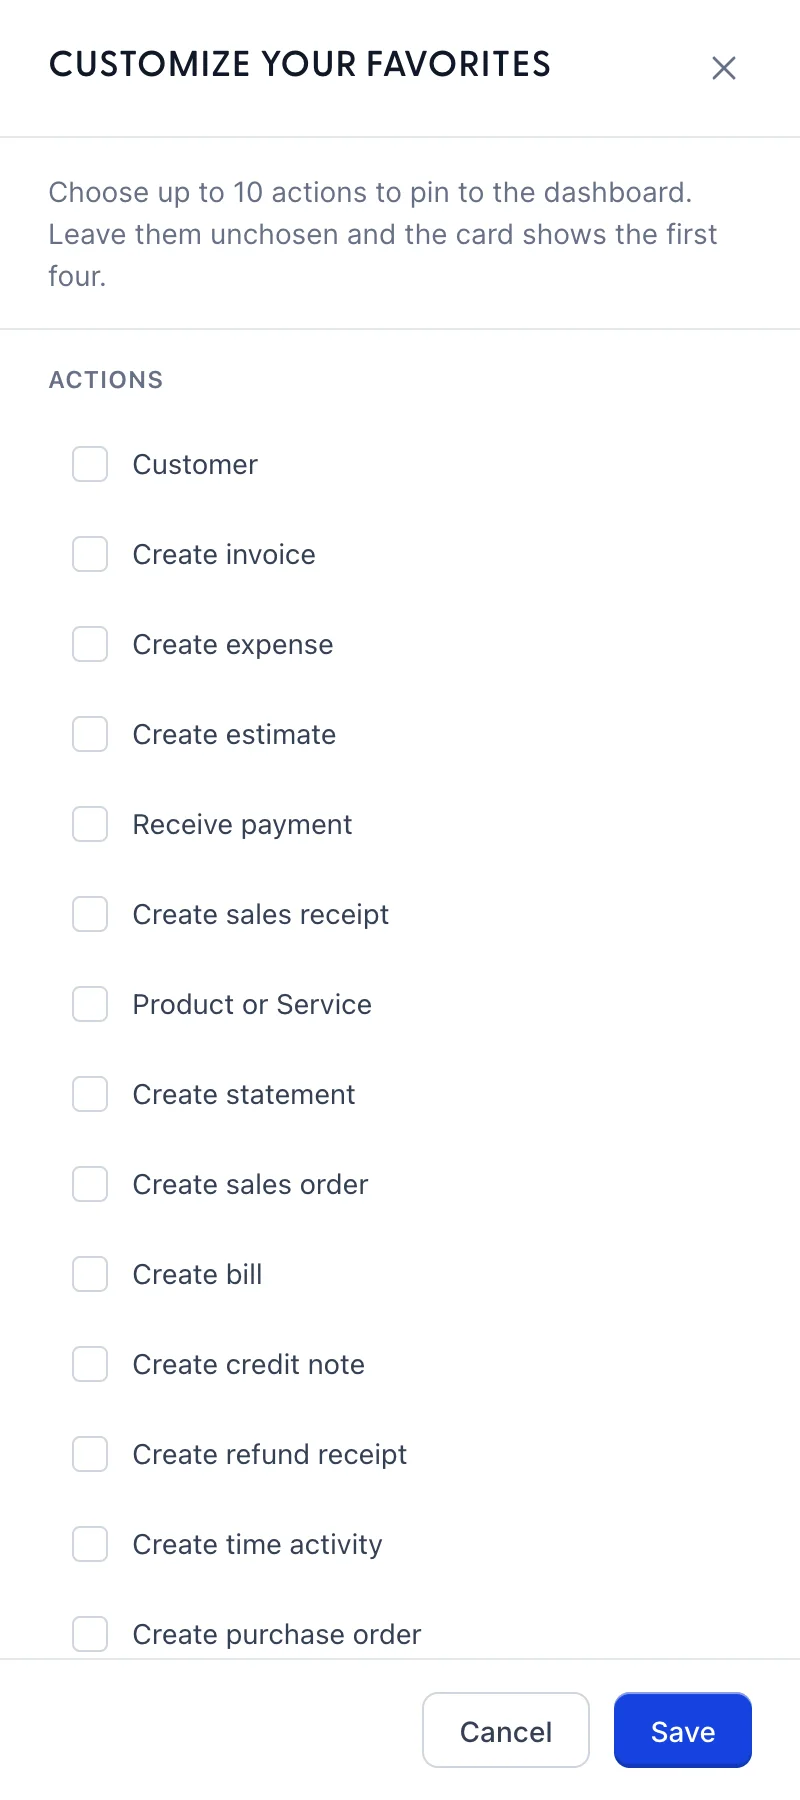
The pencil opens the panel. Tick up to ten of the twenty actions and Save. The order on the card is the order you ticked them in, so tick the one you use daily first. At ten the remaining boxes stop responding; untick something to make room.
The choice belongs to the property rather than to you, so everyone with access to this property's accounts sees the same shortcuts.
Where to go next
Every panel here is a summary of a list. What you are owed is detailed on the customer screens, what you owe on the supplier screens. The accounts that name the donut slices are in the chart of accounts, and the difference between what this screen says you hold and what the bank says is settled in bank rules and reconciliation.