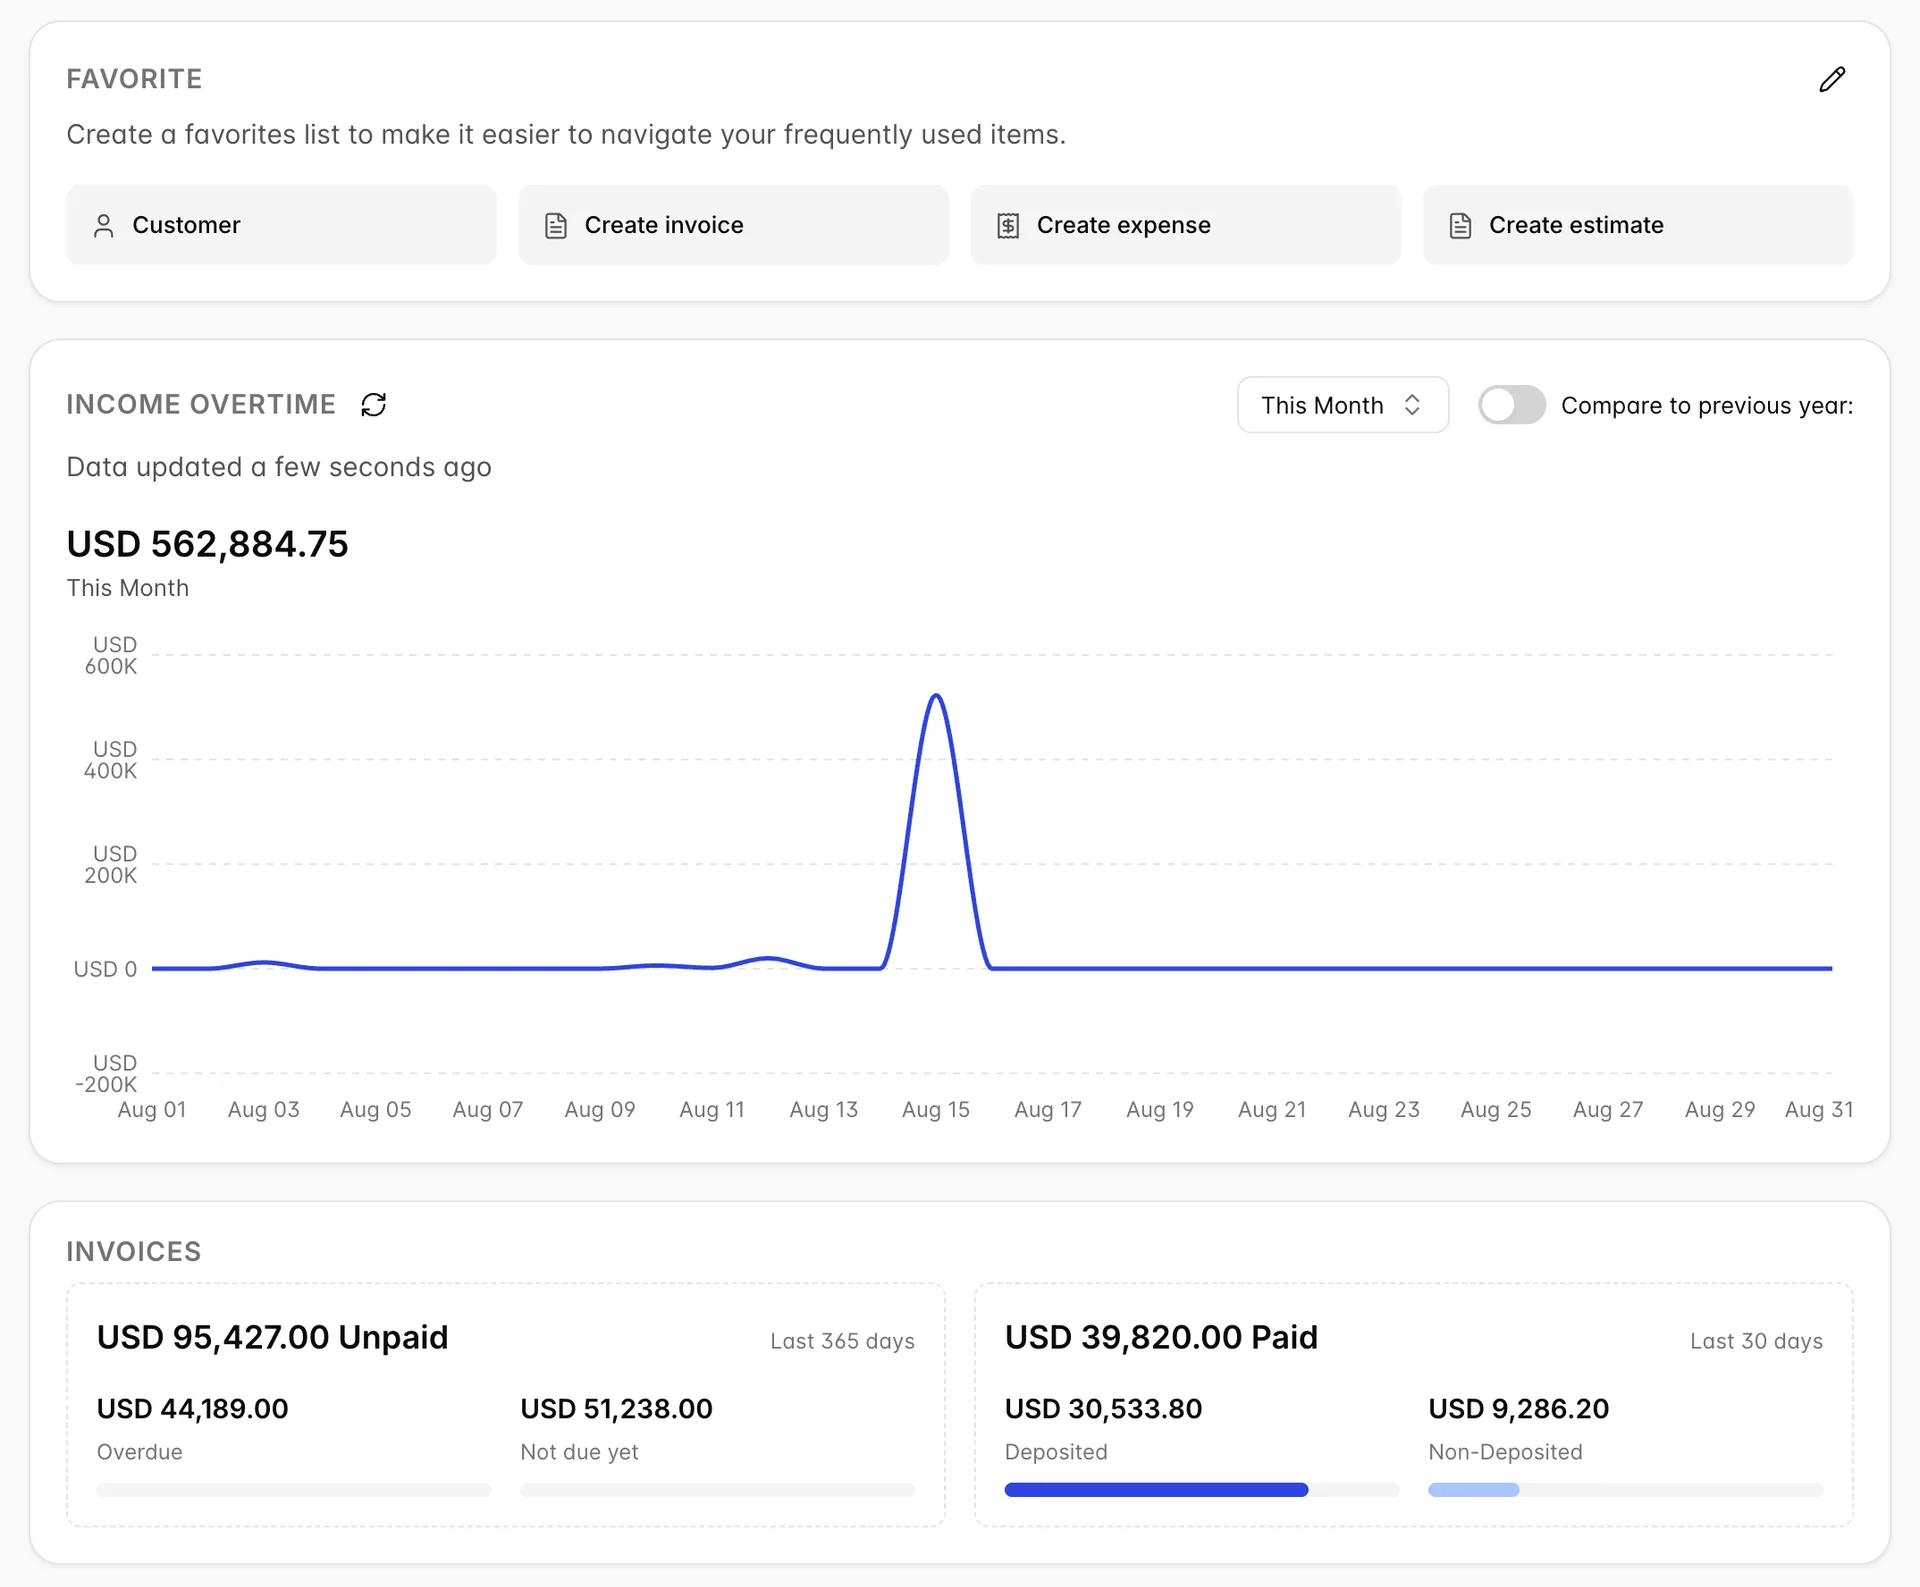
Three cards, all read-only, and only one of them is new. The middle card is the reason to open this screen: a single income total for a period you choose, drawn day by day. The card above it is the shortcut card from the accounting dashboard and the card below it is a shorter version of that dashboard's invoice panel.
What this screen is
A summary of what this module has recorded on the selling side. Nothing is typed in here and nothing saves except the shortcut card, so a figure that looks wrong is a document that is wrong.
It summarises the accounting module only. Room revenue does not arrive here because someone took a booking, and folio charges are not accounting invoices. If the totals here describe a smaller hotel than you run, read how the module fits together before looking for a fault.
The income total
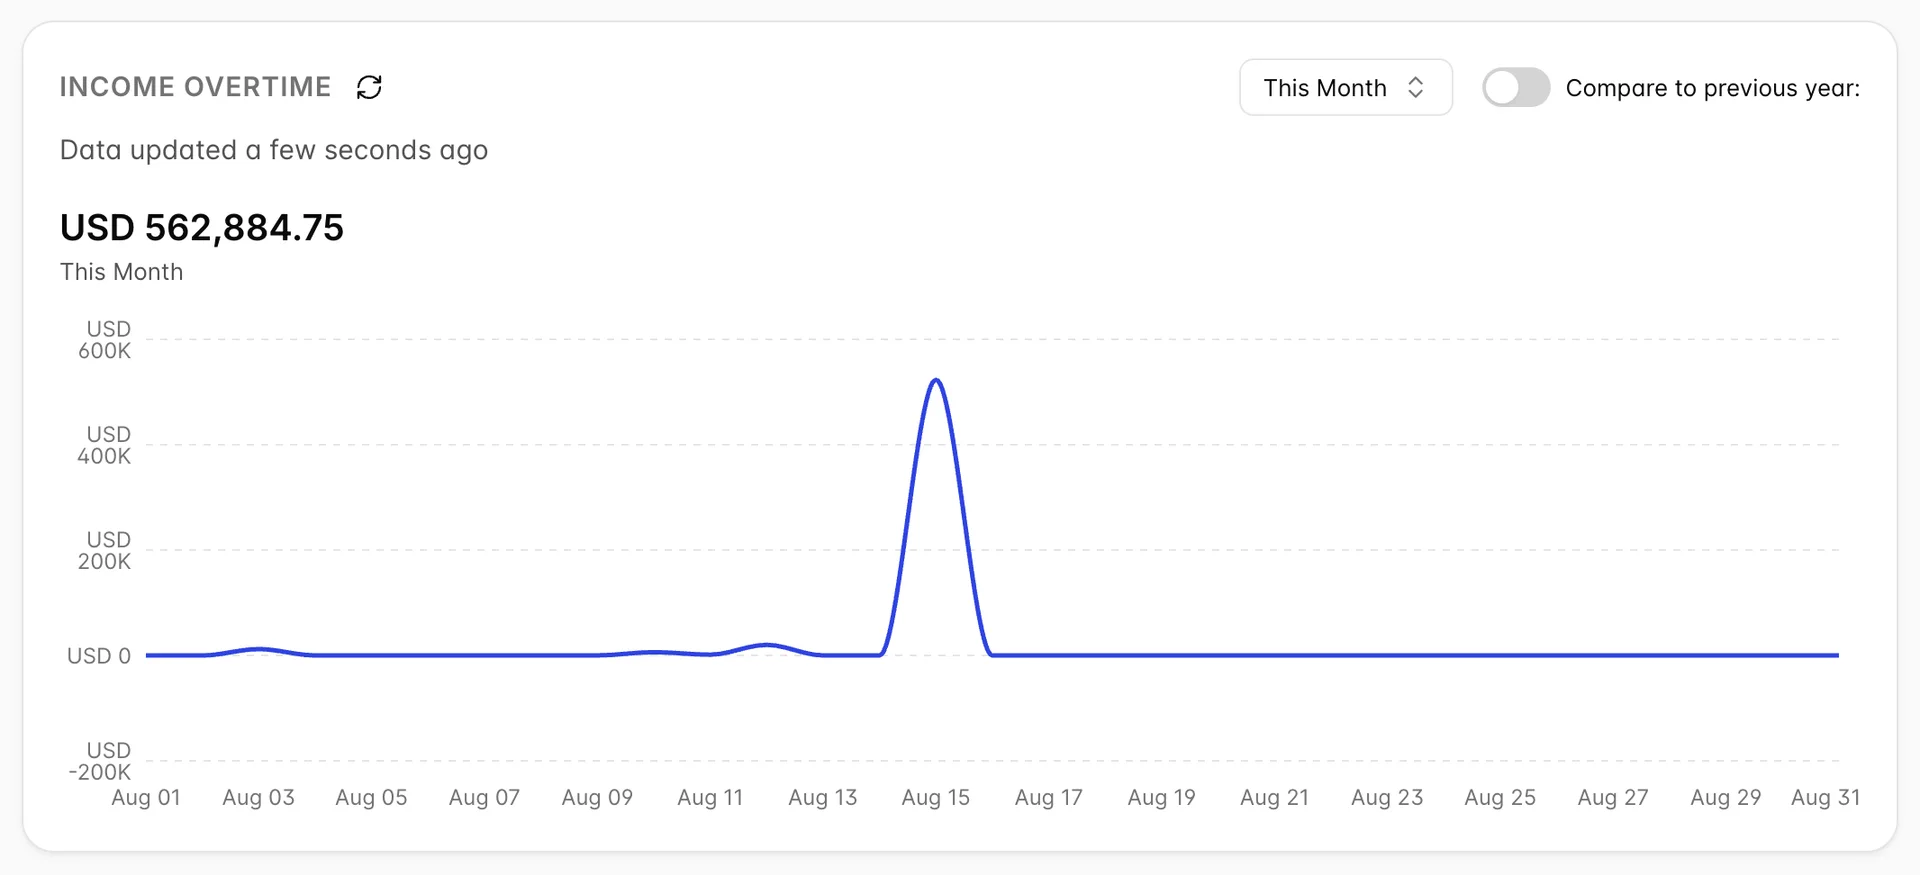
The figure on INCOME OVERTIME is what you billed and took in the period, less what you gave back by credit note, before tax. Sales tax you collected is owed to the authority rather than earned, so it is not in here.
| Counted | What that means for the total |
|---|---|
| Invoices dated in the period | In full, from the day they are dated, whether or not a penny has been collected against them. An invoice you will not be paid for until November is in this month's total. |
| Sales receipts dated in the period | In full. These are the sales that were settled as they were made, so for most properties this is where a month of desk trading lands. |
| Credit notes dated in the period | Subtracted. Crediting a room night back takes it out of the total on the day the credit note is dated, not the day the original invoice was raised. |
| Voided documents | Left out entirely, of all three types above. |
Two things are not counted and both surprise people. An estimate or a sales order is not income, however firmly it has been agreed, and it stays out until it becomes an invoice or a receipt. And a refund receipt does not reduce this total, which is the first of the four reasons the next section exists.
The refresh icon beside the heading re-reads the figures without reloading the page.
Why the dashboard reports a different income
Set this screen and the accounting dashboard to the same month and they will normally report two different income figures. This is worth understanding rather than reporting, because neither figure is broken and there are only four things it can be.
| What differs | Which way it runs |
|---|---|
| Refund receipts | The dashboard subtracts them and this screen does not count them at all. So this screen reads higher, by the total of the refund receipts dated in the period. Refund one delegate package and the two screens differ by exactly that. |
| Where the period ends | This Week, This Month, This Quarter and This Year run to the end of the period here, and stop at today on the dashboard. So on the eighteenth this screen is reading a whole month and the dashboard a fortnight, and anything dated later in the month counts here and not there. |
| Cash or accrual | The dashboard honours the Accounting method on your Advance settings. This screen has no such setting and always counts an invoice from the day it was raised. On a property set to cash the two are not two views of one sum, they are two different sums. |
| Negatives | The dashboard will not report income below zero and this screen will. A period whose credit notes outweigh its invoices reads as a negative here and as nothing at all there. |
Tax is not one of them. It is the first guess and it is wrong: both figures are before tax, so chasing a tax difference will cost you an afternoon and find nothing.
The chart, one point per day
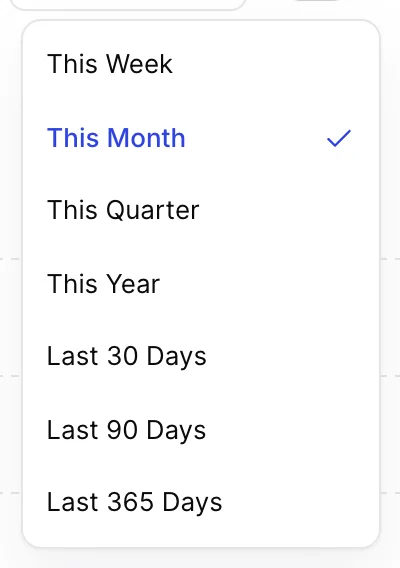
The line has one point for every day in the window, not one for every month. This Week draws seven points and This Year draws every day of the year, so the longer windows are dense rather than smoothed.
That is why the shape of this line says more about how you record revenue than about how the hotel traded. Post a month's takings as one sales receipt and you get one spike a month with the line flat on zero between them, which is the workflow showing through and not a quiet fortnight. Invoice agencies as they check out and you get a scatter of smaller points instead.
The flat stretch at the right-hand end of a This Month or This Year chart is the part of the period that has not happened yet. Those windows run to the end of the period, so on the fifteenth half of August is drawn as zero. Nothing has gone wrong and there is no downturn to explain.
Choose one of Last 30 Days, Last 90 Days or Last 365 Days when you want a chart that ends today instead.
Comparing against last year
Turning on Compare to previous year re-reads the figures and adds the same run of dates a year earlier, plus a figure for the difference between the two totals. The comparison always moves with your chosen window: pick This Quarter and it is this quarter against the same quarter last year.
It needs a year of documents behind it to say anything, and it does not say so when it has none. A property in its first year of Prostay still gets the second line: it lies flat along zero for the whole window, and the difference figure restates the total you can already see. So read a comparison that looks like enormous growth over a year of nothing as what it is, a year you were not on Prostay for, rather than a year of no trading.
The invoice card
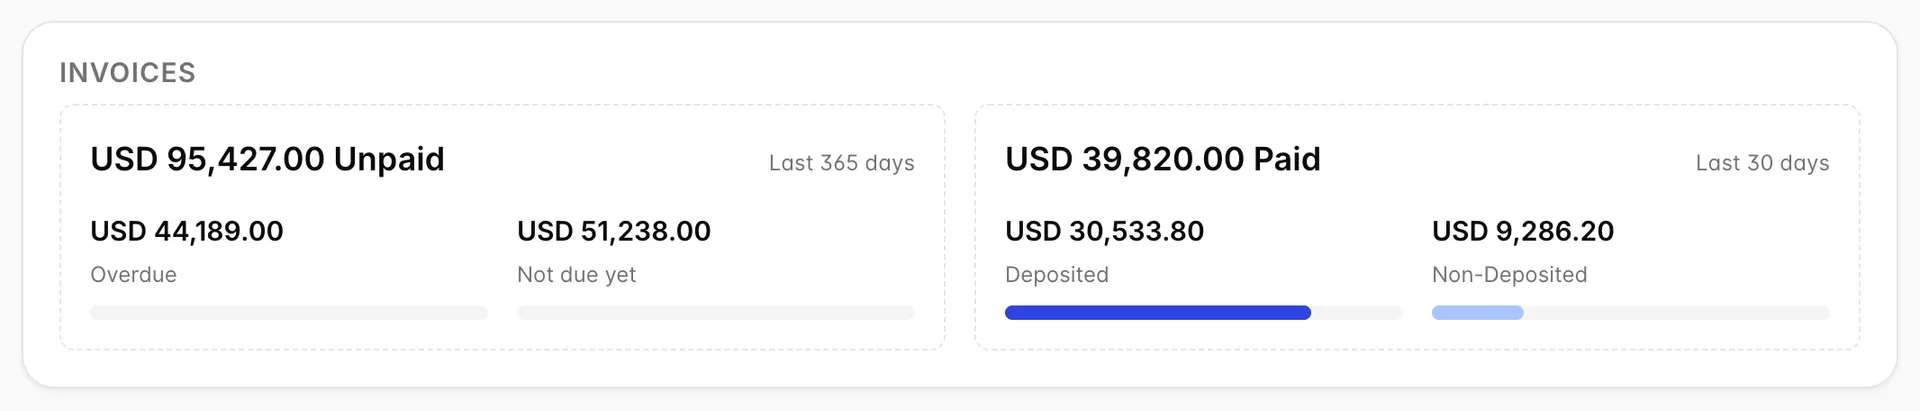
Four figures over two windows, and the windows are fixed. The Last 365 days and Last 30 days above each half are labels rather than controls: unlike the dashboard's invoice panel, there is nothing here to set.
| Figure | What it counts |
|---|---|
| Unpaid | What is still owed on invoices dated in the last year. An invoice older than that is not here however overdue it is, which is the usual reason this figure is smaller than a customer's balance. |
| Overdue | The part of it past its due date. An invoice with no due date is never counted here, whatever its age. |
| Not due yet | The rest, plus every unpaid invoice that was saved without a due date. |
| Paid | Payments received in the last thirty days against invoices that are now settled in full. Dated on the payment, not the invoice, so a fourteen month old invoice paid last week is in this figure and its invoice is in neither of the two above. |
| Deposited | The part of that money recorded against an account that is not an undeposited funds one, which for most properties means it reached the bank. |
| Non-Deposited | The rest: money recorded into an undeposited funds account, and money recorded with no account named at all. Card takings the acquirer has not settled and cheques not yet banked sit here. |
Two scope rules on this card catch people out, and both are worth knowing before you try to make the halves add up.
A part payment is in neither half. Only payments against invoices that are now fully settled reach the Paid figure. Take half of a large invoice today and that money is absent from the paid total, while the unpaid half of the same invoice sits in Unpaid. Collect the rest and both payments count, but only those of them still dated inside the last thirty days. Settle a long-running invoice whose deposit was taken in the spring and the deposit never appears here at all.
A draft invoice is in the income total and not on this card. The card leaves drafts out and the income total above counts them from the day they are dated. So if the two will not reconcile, look for invoices still in draft before looking for anything else, and raise them properly.
The shortcuts card
FAVORITE is the same card as the one on the accounting dashboard, drawing on the same list of twenty actions, and the two stay in step because the choice belongs to the property rather than to the screen. Pin something here and it is pinned on the dashboard too.
Until anybody chooses, it shows the first four of that list: Customer, Create invoice, Create expense and Create estimate. The pencil opens the panel that changes them, and choosing them is covered under the favourites card rather than twice.
Where to go next
Every figure here is a summary of a list. The documents behind the income total are on All Sales, which is also where you can see which of them are drafts. What each customer owes is on the customer screens, and applying a payment against an invoice is getting paid. If you are about to raise the document that will move these figures, start at which sales document to use.