If you have already set your base rates and built your rate plans, you have told Prostay what a room costs. Revenue Management is about when that price should change. It reads the same accommodation types, the same inventory and the same rate plans, and adds a layer of decisions on top: how high and how low a rate may go, what should trigger a change, and whether a change needs your approval before it happens.
Nothing in here replaces your rate setup. When the module changes a price it writes an override on that night, which you can see and clear on the rate calendar. Your base rate intervals are untouched, so switching the module off leaves you exactly where you started.
What it adds to the rates you already set
Four things, and none of them has a screen anywhere else in Prostay:
| What it adds | Why the rest of Prostay cannot do it |
|---|---|
| Automated pricing strategies | Six rules that watch occupancy, lead time, day of week, season and booking pace, and move a rate when one of them is met. Your base rate intervals are dated, not conditional: they cannot say "raise this if the night fills". |
| Rate floors and ceilings | A minimum and a maximum per accommodation type, which nothing may price outside. There is no equivalent limit on a base rate or a rate plan, because those are prices rather than ranges. |
| Seasons | Named stretches of the year typed peak, high, off-peak or standard, either drawn by you or detected from your booking history. These hold no prices: they multiply whatever your intervals already say. This is why the base rates article tells you there is no seasons screen in your rate setup. There is one, and it is here. |
| Pickup and pace analysis | How fast a future date is filling compared with the same point last year. Every other report in Prostay describes what has happened; this one describes the rate of change on dates that have not happened yet. |
Reading the dashboard
The module opens on a summary of where you are now. It is a reading screen: nothing here can be changed, and the figures come from the same endpoints the PMS Performance Center uses, so the two should agree for any given day.
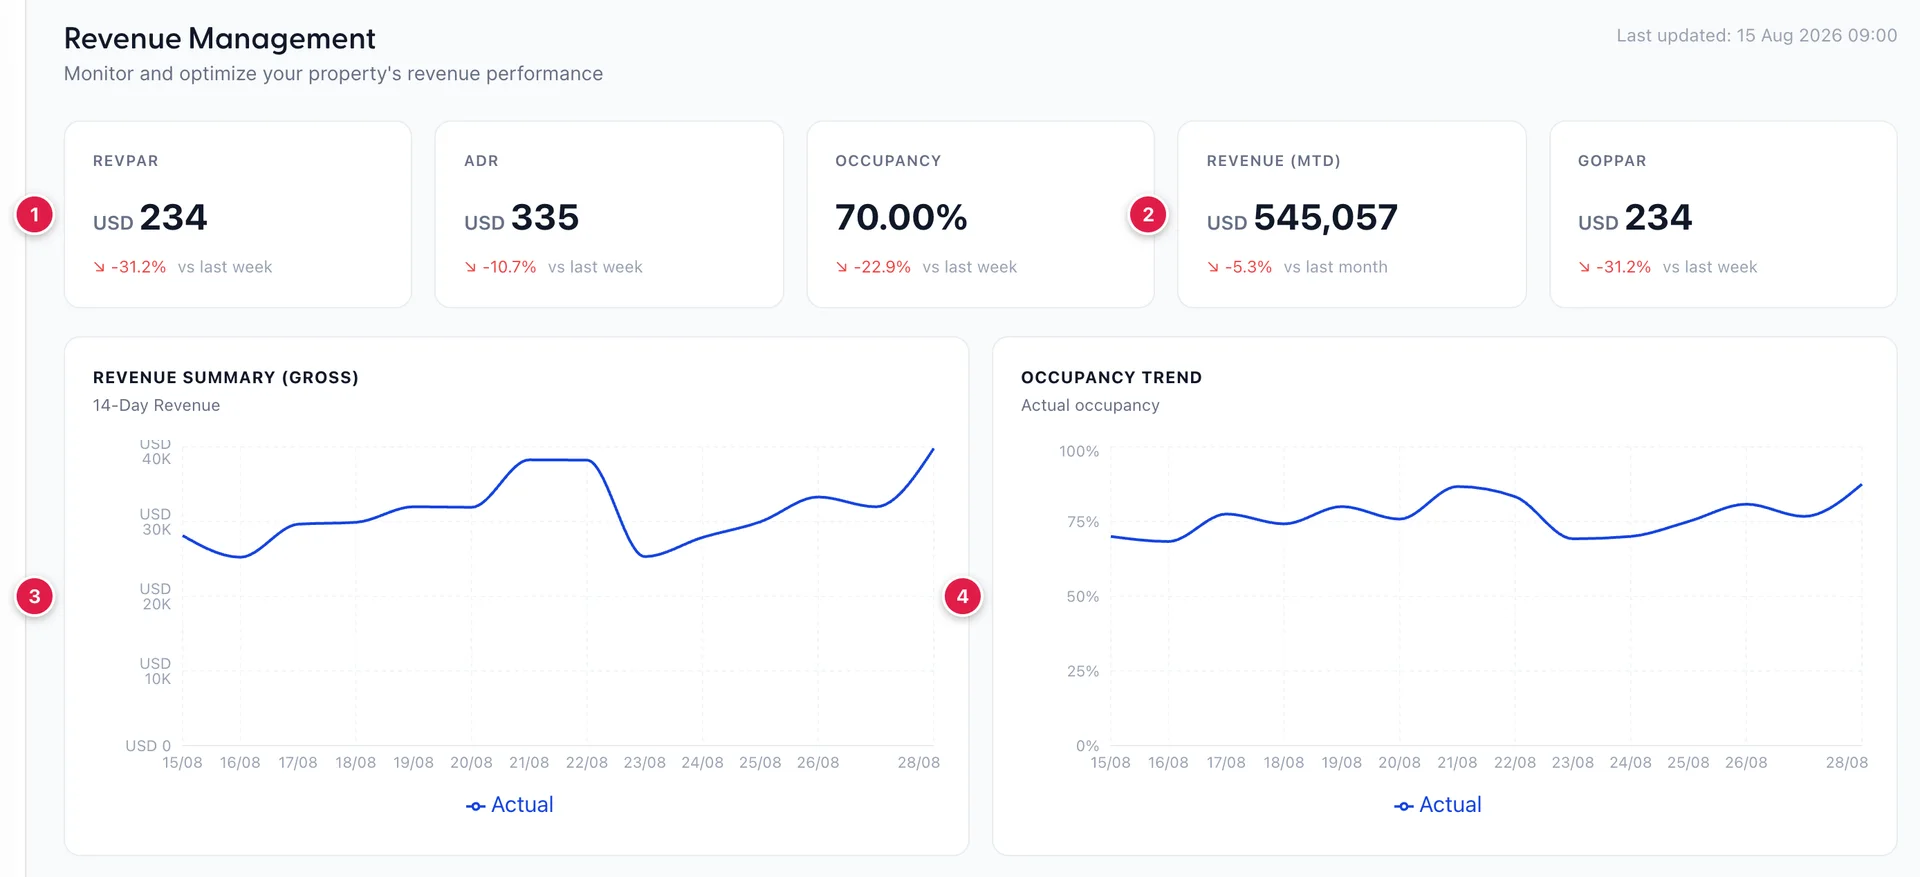
- The tile row, covering today's trading.
- The one tile measured against last month rather than last week, because it is a month-to-date total.
- Fourteen days of gross revenue, starting today.
- The same fourteen days as an occupancy percentage.
The five tiles

Left to right the row is REVPAR, ADR, OCCUPANCY, REVENUE (MTD) and GOPPAR. The four you will act on:
| Tile | What it is, and what moves it |
|---|---|
| REVPAR | Room revenue divided by every room in the house, including the ones you did not sell. It falls when you discount and it falls when you leave rooms empty, which is why it is the number to watch rather than ADR alone: a high ADR on a half-empty house is a worse night than a lower ADR on a full one. |
| ADR | Room revenue divided by the rooms you actually sold. It says nothing about how many you sold, so read it beside occupancy or not at all. |
| OCCUPANCY | Rooms sold as a percentage of the house. This is the same figure the PMS House Status card shows for the same day, so if the two disagree, one of them is looking at a different date. |
| REVENUE (MTD) | Gross room revenue so far this calendar month. Its comparison is against last month, not last week, so early in a month it will look alarming for no reason: three days of trading against a whole month is not a like-for-like comparison. |
The fifth tile is labelled GOPPAR. Gross operating profit needs your cost base, which Prostay does not hold, so treat this tile as informational and do not price against it.
The two charts
Both cover the next fourteen nights starting today, which makes them a forward view rather than a report: the revenue line is what is on the books for those nights, not what you have earned. A dip in the middle of the revenue chart is a soft date you still have time to do something about, and it is the fastest way to spot one on this screen.
Read them together. Revenue falling while occupancy holds means you are selling the same rooms cheaper. Occupancy falling while revenue holds means you are selling fewer rooms at a better rate, which may be exactly what you intended. The occupancy axis is fixed at 0 to 100%, so the shape of the line is comparable from one week to the next.
The Reports screen, and where its numbers are explained
Reports & Analytics inside this module is the same reporting data the Reports screens hold, drawn as charts and gathered onto one screen so a revenue manager does not have to leave. Five tabs: Revenue Summary, Occupancy Analysis, Channel Performance, Rate Plan Analysis and Room Type Analysis. It opens on Channel Performance.
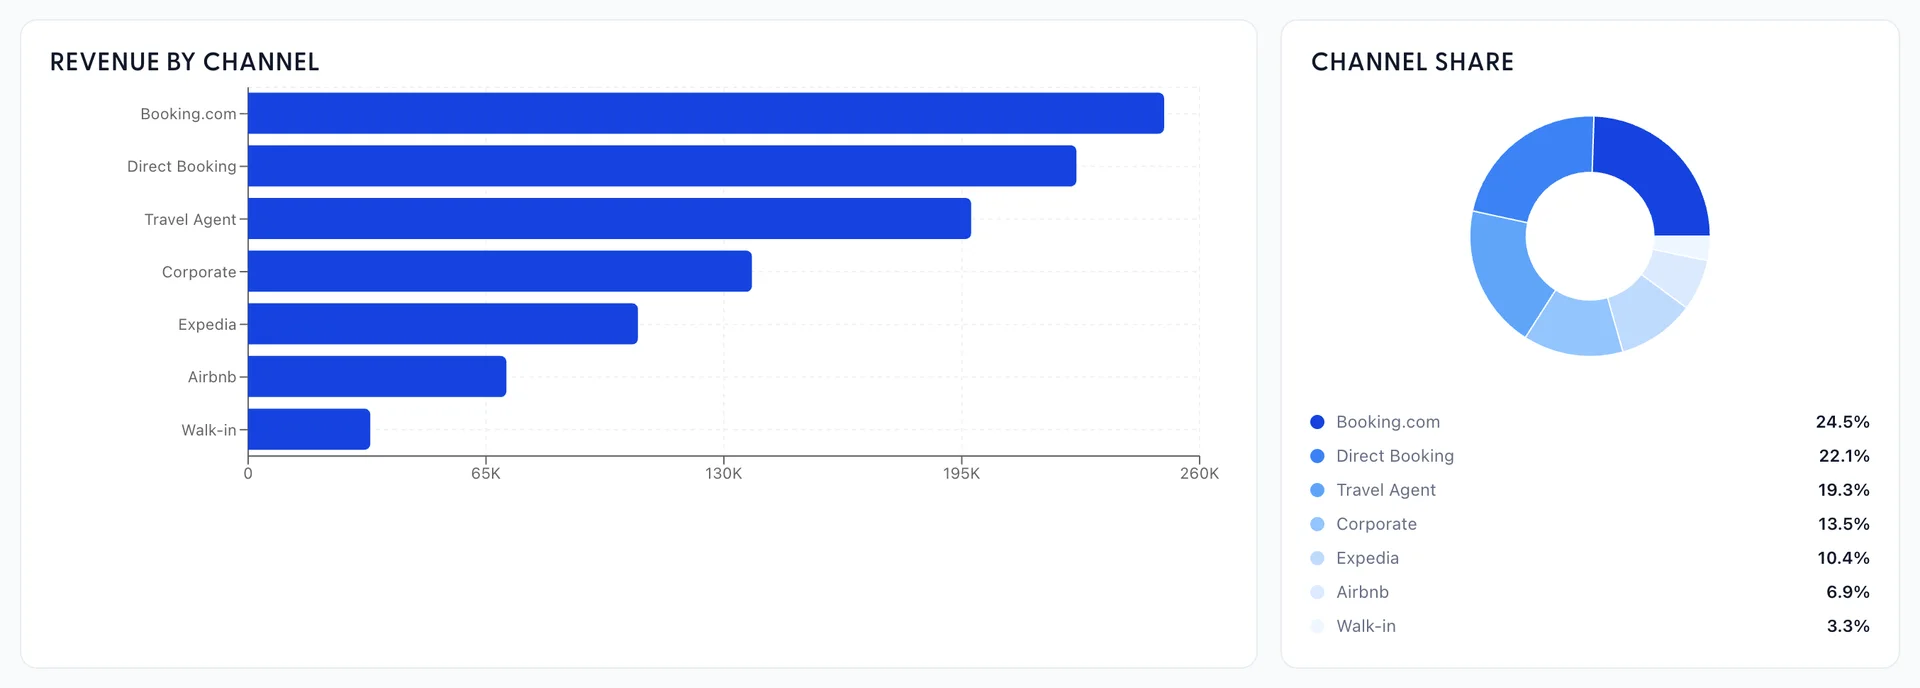
There is no new data on this screen, so rather than describe the columns twice, here is where each tab is explained properly:
| Tab | The article that explains its arithmetic |
|---|---|
| Channel Performance | This is the Revenue by Booking Source report with a bar chart and a doughnut on top, including the commission each channel charges and the net revenue after it. See room revenue by source, type and plan, and source types and commissions for where those percentages are set. |
| Rate Plan Analysis | Revenue split by rate plan. Same report, same source: see room revenue by source, type and plan. |
| Room Type Analysis | Revenue split by accommodation type, from the same report again. |
| Revenue Summary | Daily room revenue and ADR. The Performance Center article explains how these are calculated and invites you to check the arithmetic. |
| Occupancy Analysis | Occupancy over the chosen range, on the same basis as the occupancy tile above. |
Two differences from the Reports screens worth knowing. The date range here is four chips, 7D, 30D, 90D and YTD, rather than an explicit from and to, so you cannot ask for a specific fortnight. And Export PDF exports the tab you are looking at, not the whole screen, so a full picture is five exports.
Emailing a report on a schedule
Scheduled Reports, top right, is where a report gets sent to somebody by email without them opening Prostay. Each row is one schedule.
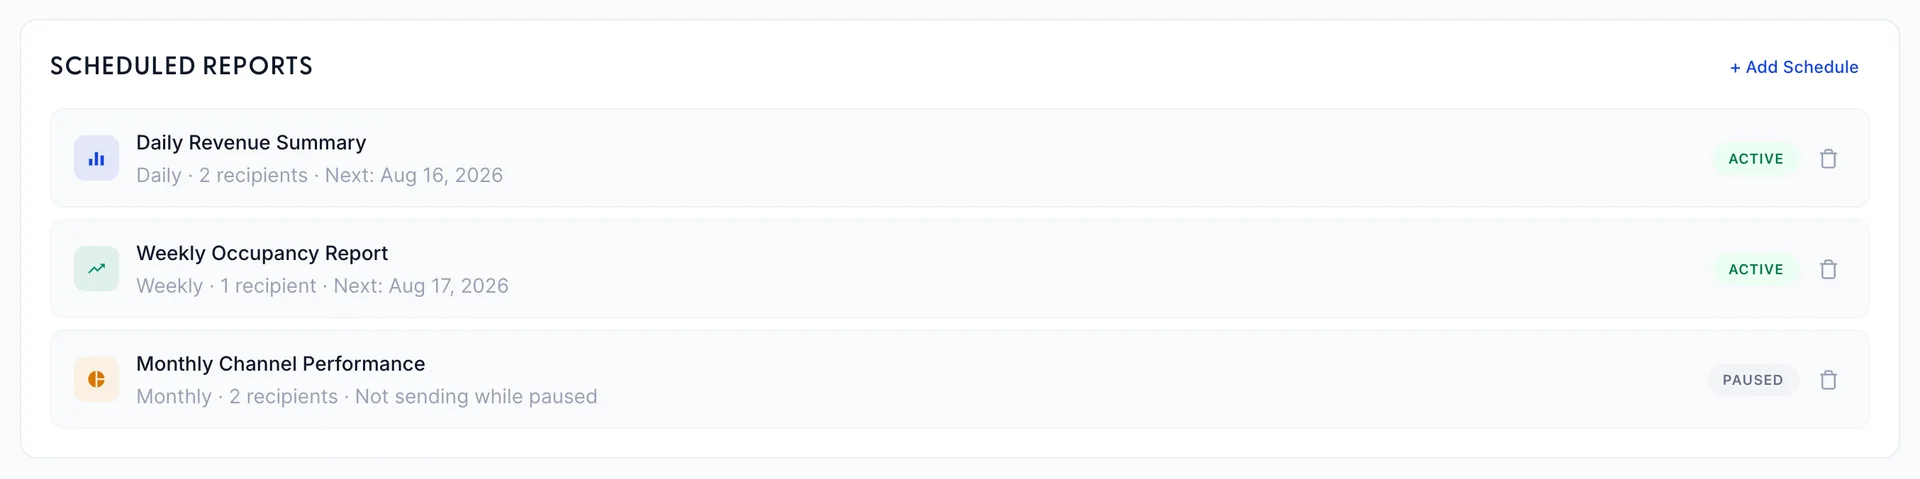
The line under each name is the frequency, how many people it goes to, and the date it next sends. Click the ACTIVE chip to pause a schedule and the chip to PAUSED to start it again; a paused schedule keeps its recipients and its frequency and simply stops sending. The bin deletes it outright, with no confirmation step.

- Click + Add Schedule.
- Name it something the recipient will understand in their inbox, because the name is all they see.
- Choose which of the five reports to send, and a frequency of Daily, Weekly or Monthly. Daily sends tomorrow, weekly on the coming Monday, monthly on the first of next month.
- Enter the recipients, separated by commas. At least one is required, and a schedule with nobody on it is refused rather than saved and silently never sent.
- Click Save schedule. It starts active.
Where to go next
Four articles cover the rest of the module, and the order matters:
- Automated pricing with Autopilot first. Set your floors and ceilings before anything else, because they are what limits every other decision in the module. That article also covers the strategies, the seasons and the suggestion queue.
- Overriding a night's rate, and reading pickup and pace second, for the day-to-day work of changing one date by hand and watching how future dates are filling.
- Forecasting demand third, and only when you want to look further out than pickup does. It projects occupancy, ADR and RevPAR over the next thirty, sixty or ninety days and marks the days it expects to be busy. Nothing on that screen changes a price; it is the one part of the module you read rather than act in.
- Rate parity last, and on a different cadence from the rest. The other three are about what you charge; this one is about whether the channels you sell through are charging it. Most properties look at it weekly rather than daily, and like forecasting it is a screen you read rather than act in.
If what you actually want is to change what a room costs rather than when it changes, you are in the wrong module. Base rates and rate plans are where prices are set.