Your base rates say what a room costs across a stretch of dates. Some nights are not like their neighbours: a conference fills the town, a wedding party takes half the house, a Tuesday in the shoulder season refuses to sell. The rate calendar is where you change one of those nights without rewriting the interval it sits in, and Pickup and Pace is where you find out which nights need it.
Reading the rate calendar
Go to Revenue Management > Rate Calendar. One row per accommodation type, one column per night, and the price you would charge in each cell.
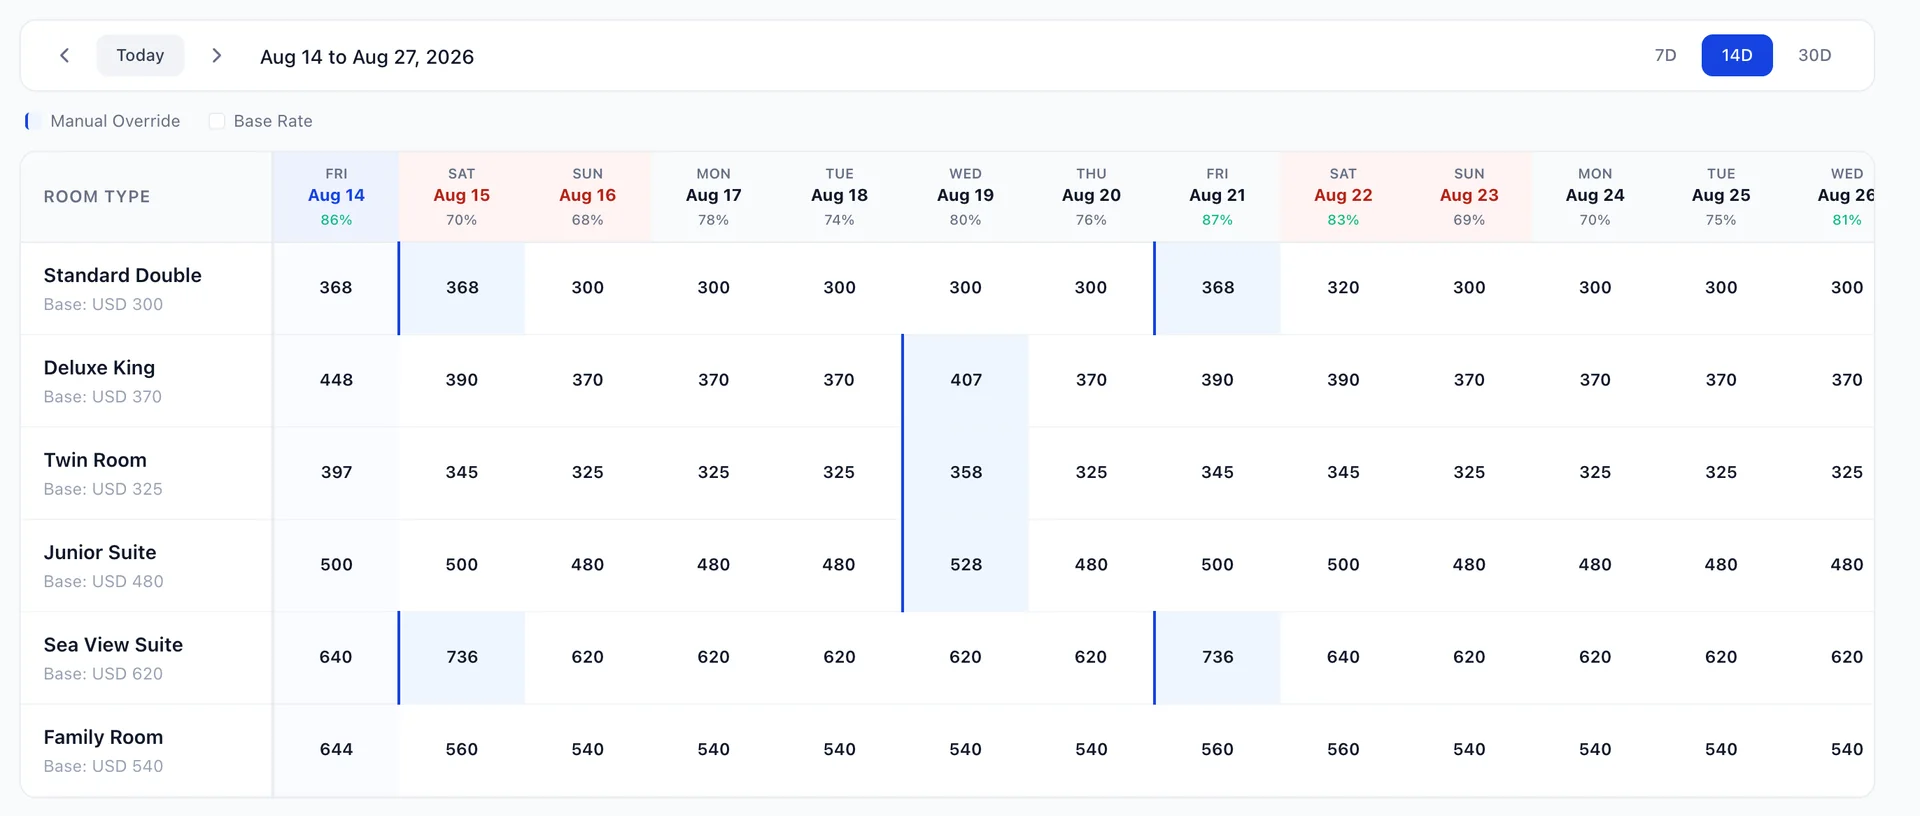
Four things to orient yourself with before you change anything:
| Where | What it tells you |
|---|---|
| Toolbar, left | Arrows step the window forward and back by its own length, and Today jumps back to the current date. The date range beside them describes the columns on screen, first to last. |
| Toolbar, right | 7D, 14D and 30D set how many nights the grid shows. Fourteen is the default and is usually the right one for pricing decisions; thirty is for scanning, because the columns get narrow. |
| Under each date | A percentage: how full the house is on that night. Weekends are shaded, and today's column is picked out in the property's own timezone rather than yours, so a manager travelling does not see the highlight land on the wrong day. |
| Under each room name | Base: followed by that type's midweek rate for the interval covering the first night on screen. It is there as a reference point for the row, not as the price of any particular cell. |
That last one is worth reading twice, because it is the most common misreading of this screen. A cell that differs from the Base figure beside the room name is not necessarily overridden. Your base rate interval can price Friday and Saturday differently from midweek all by itself, and most properties do. The row label shows one number; the row shows what each night actually costs.
The marker on a cell is what tells you the difference. The legend for it sits just under the toolbar, and there are only two states. Base Rate means the cell is showing whatever your rate setup says for that night, including any day-of-week difference. Manual Override means somebody, or Autopilot, has pinned that one night to a different figure. Autopilot's own changes appear here as overrides too, which is how you can see what the engine did on a screen you already know; its activity log lists them by date if you want the reason as well.
Changing one night for one accommodation type
Click the cell. It becomes an input with a Save button beside it, and the Rate Details panel opens on the right at the same time. Type the new figure and either press Enter or click Save. Escape leaves the cell as it was.
What you have changed is that one accommodation type on that one night. Nothing else moves: not the neighbouring nights, not the other room types, and not the base rate interval the night sits in. That is the point of the screen. If you want the change to apply to a stretch of dates or to follow a rule, this is the wrong place, and Autopilot or your base rate intervals are the right ones.
The Rate Details panel
The panel is the same cell you clicked, spelled out, plus one thing the grid cannot show you.
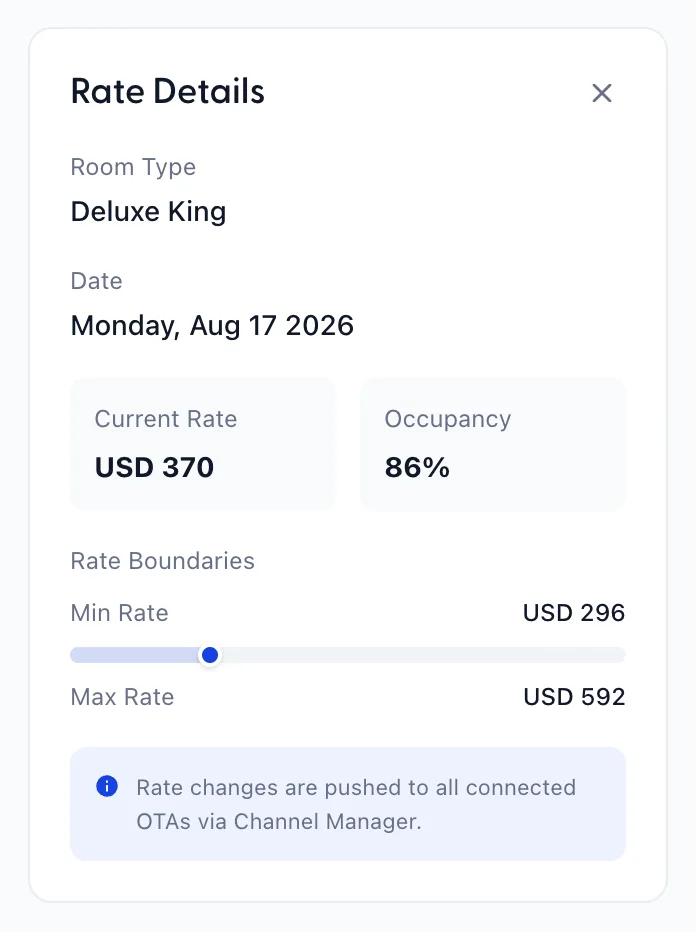
Room Type and Date confirm which cell you are about to change, which matters more than it sounds on a thirty-day view where the columns are narrow. Current Rate is the cell's own figure and Occupancy is how full that accommodation type is on that night, not the house.
Rate Boundaries is the part worth pausing on. The bar places the current rate between the floor and the ceiling you set for that type on the Pricing Rules screen, so you can see at a glance whether a rate is sitting near the top of its permitted band or has plenty of room left. Those are the same boundaries Autopilot may not cross. They are shown here as context for your decision rather than as a limit on it: this screen is you overriding a night by hand, and the floor and ceiling are there to constrain the engine.
What you cannot do from this screen
Three limits, all worth knowing before you plan a session at this screen:
- There is no button that returns a night to its base rate. Typing the base figure back into the cell restores the price, but the cell stays marked as an override. If you rely on that marker to see what has been touched, note the dates you change.
- There is no bulk edit. One cell at a time. Repricing a fortnight of weekends by hand is thirty clicks; changing the interval or letting a strategy do it is the alternative.
- Restrictions are not here. Minimum stay, closed to arrival and stop sell live on the Pricing Rules screen and on the availability matrix, not in these cells. This grid is prices only.
Pickup and pace: is this date filling or not
Go to Revenue Management > Pickup & Pace. The rate calendar tells you what you are charging. This screen tells you whether it is working, by comparing every upcoming arrival date against the same date last year at the same distance out.
That last phrase is the whole idea. Knowing that next Saturday has 71 rooms sold means little on its own. Knowing that last year, with the same number of days still to go, it had 74, tells you whether you are behind. Every comparison on this screen is measured against last year; there is nowhere to enter a budget or a target, and nothing here is one.
The room type selector at the top right narrows everything below it to a single accommodation type, which is how you find out that the house looks fine only because the suites are carrying it.
The five tiles, and what ahead and behind mean

| Tile | What it counts |
|---|---|
| Overall Pace | The average of every date's pace across the window, as a percentage against last year at the same point. Green above zero, red below. |
| Dates Ahead | How many arrival dates are more than 5% up on last year at the same point. |
| Dates Behind | How many are more than 5% down. Anything between the two is treated as on track and counted in neither tile, so the two numbers will not add up to the window. |
| 7-Day Pickup | Room nights booked across the whole window in the last seven days. This is the tile that tells you whether demand is arriving at all. |
| Today's Pickup | Room nights booked today, same window. |
Read the first three together. An Overall Pace of a point or two either way can hide a dozen dates well ahead and a dozen well behind, and the two counts are what expose that. A flat average with most dates in neither column is a genuinely quiet window; a flat average with dates piled into both is a mix problem worth opening the table for.
The two charts
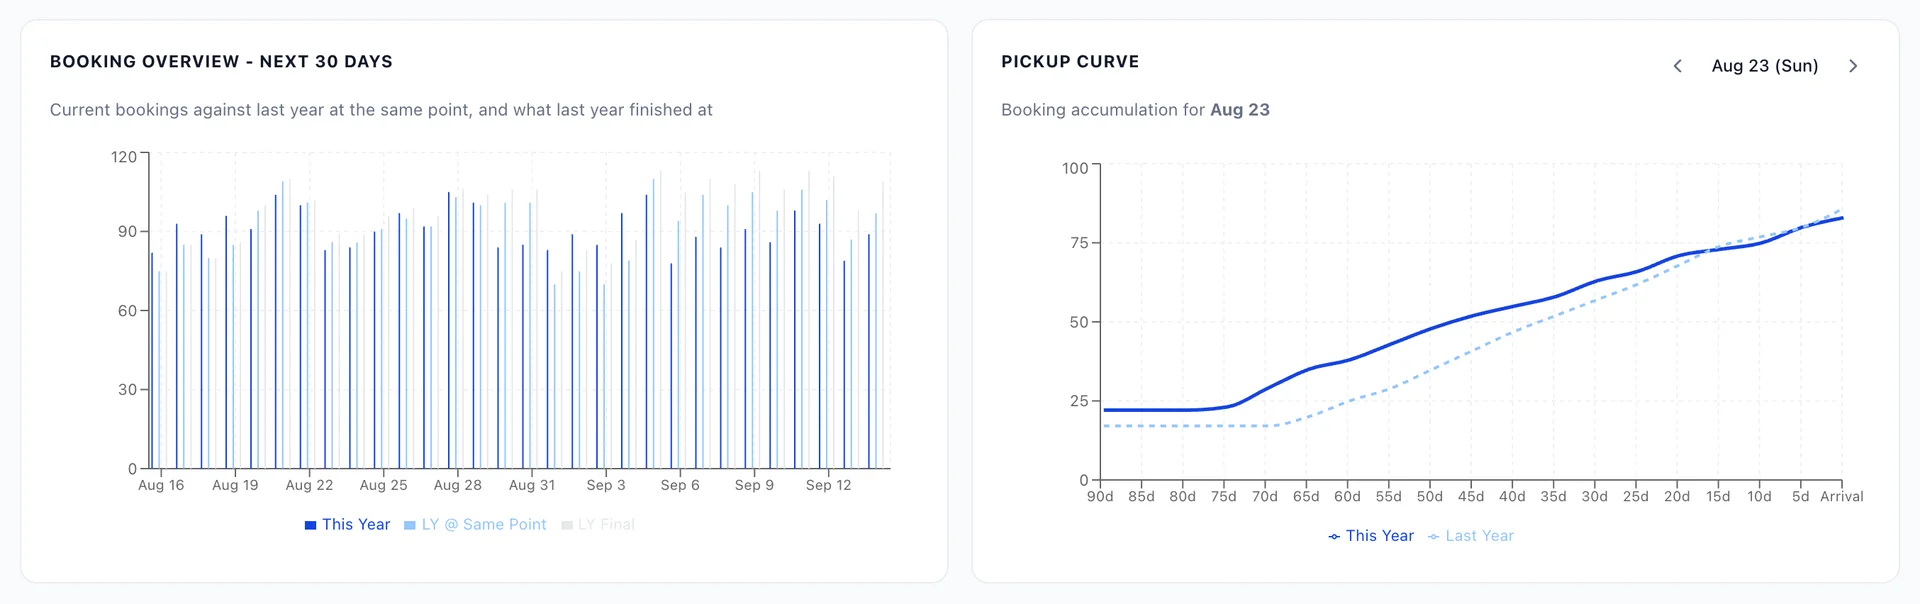
Booking Overview puts three bars on each of the next thirty nights:
- This Year is what you hold now.
- LY @ Same Point is what last year held with the same number of days left. This is the honest comparison, and it is what the pace percentages are calculated from.
- LY Final is what last year finished at. The gap between it and LY @ Same Point is how much late business that date took last year, which is the best guide you have to how much is still to come.
A date sitting level with LY @ Same Point on a night that historically picked up thirty rooms in the final week is in a very different position from one that historically picked up two, even though both are on track. That is the judgement this chart exists to support.
Pickup Curve takes one arrival date and shows how it accumulated bookings from ninety days out to arrival, this year against last year. Step through dates with the arrows above the chart, or click any row in the table below to load its curve. A curve that runs flat and then climbs steeply is a date that books late; one that fills early and plateaus is a date where waiting will not help you.
The table, date by date
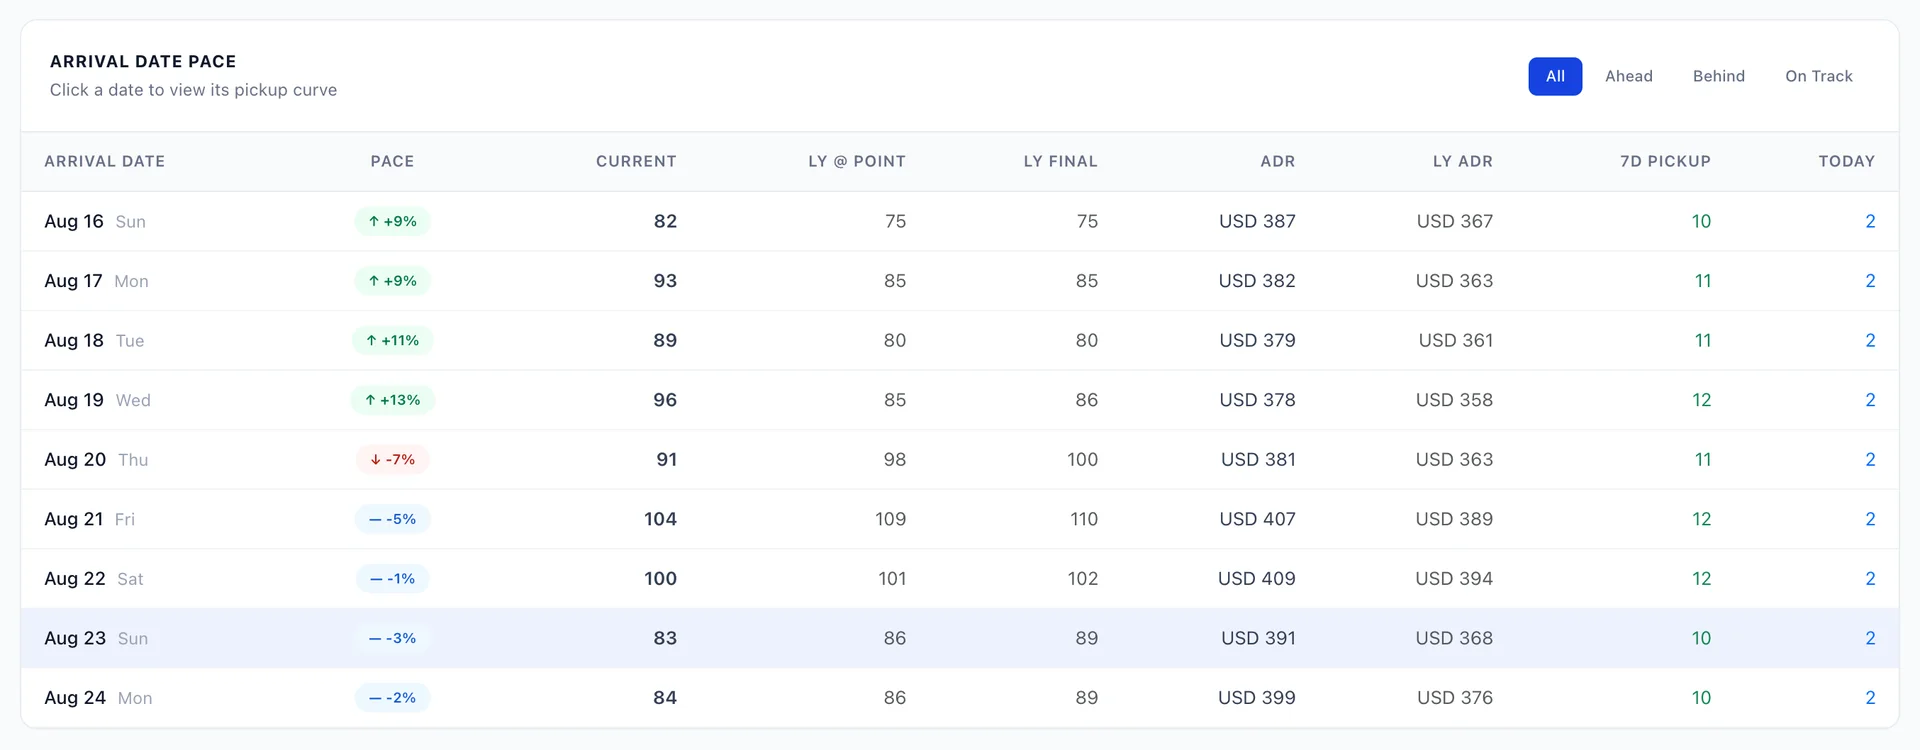
The chips above the table filter it to Ahead, Behind or On Track using the same 5% thresholds as the tiles. Behind is the one to start with.
| Column | What it is |
|---|---|
| Pace | Current bookings against LY @ Point, as a percentage, with an arrow and a colour for the three states. |
| Current | Rooms sold for that arrival date now. |
| LY @ Point | What last year held with the same days to go. |
| LY Final | What last year finished at. |
| ADR / LY ADR | Average daily rate for that date now, against last year's. Read this next to Pace: a date 10% down on rooms but 12% up on rate is not necessarily a date in trouble. |
| 7D Pickup / Today | Rooms booked for that date in the last seven days, and today. A date well behind with steady pickup is recovering; one well behind with none is not. |
Using the two screens together
The pair works in one direction. Pickup and Pace finds the dates worth an intervention, and the rate calendar is where you make it.
- Filter the table to Behind and look at the dates with little or no recent pickup, because those are the ones a price change can still affect.
- Check LY Final against LY @ Point on those dates. If last year's late business was thin, waiting is not a strategy.
- Compare ADR with LY ADR before you discount. If you are holding fewer rooms at a much better rate, revenue for that night may already be ahead.
- Open the rate calendar on that date, click the cell for the type that is short, and check the boundary bar in the panel before you decide how far to move.
If you find yourself doing this every week for the same reasons, that is the argument for letting a strategy do it. The lead time and occupancy based strategies in Autopilot exist to make exactly these adjustments without you watching the table, and Suggest Only mode lets you see what they would have done before you hand the decision over.