This is the only screen in Prostay that reports on your direct business by itself. Everything on it counts bookings that came through your own booking engine and nothing else, which is what makes it worth reading: it answers the question of whether the engine is earning the commission it saves you.
What this page counts
Every figure here is the Direct Booking channel's slice of your trading. The same reservations appear in the property-wide performance reports as well, where they are one source among many, so the numbers on this page will always be smaller than the ones on Reports › Performance. That is not a discrepancy. If you want to compare direct against your OTAs, Production by Booking Source is the screen that puts them side by side.
The header and your engine address

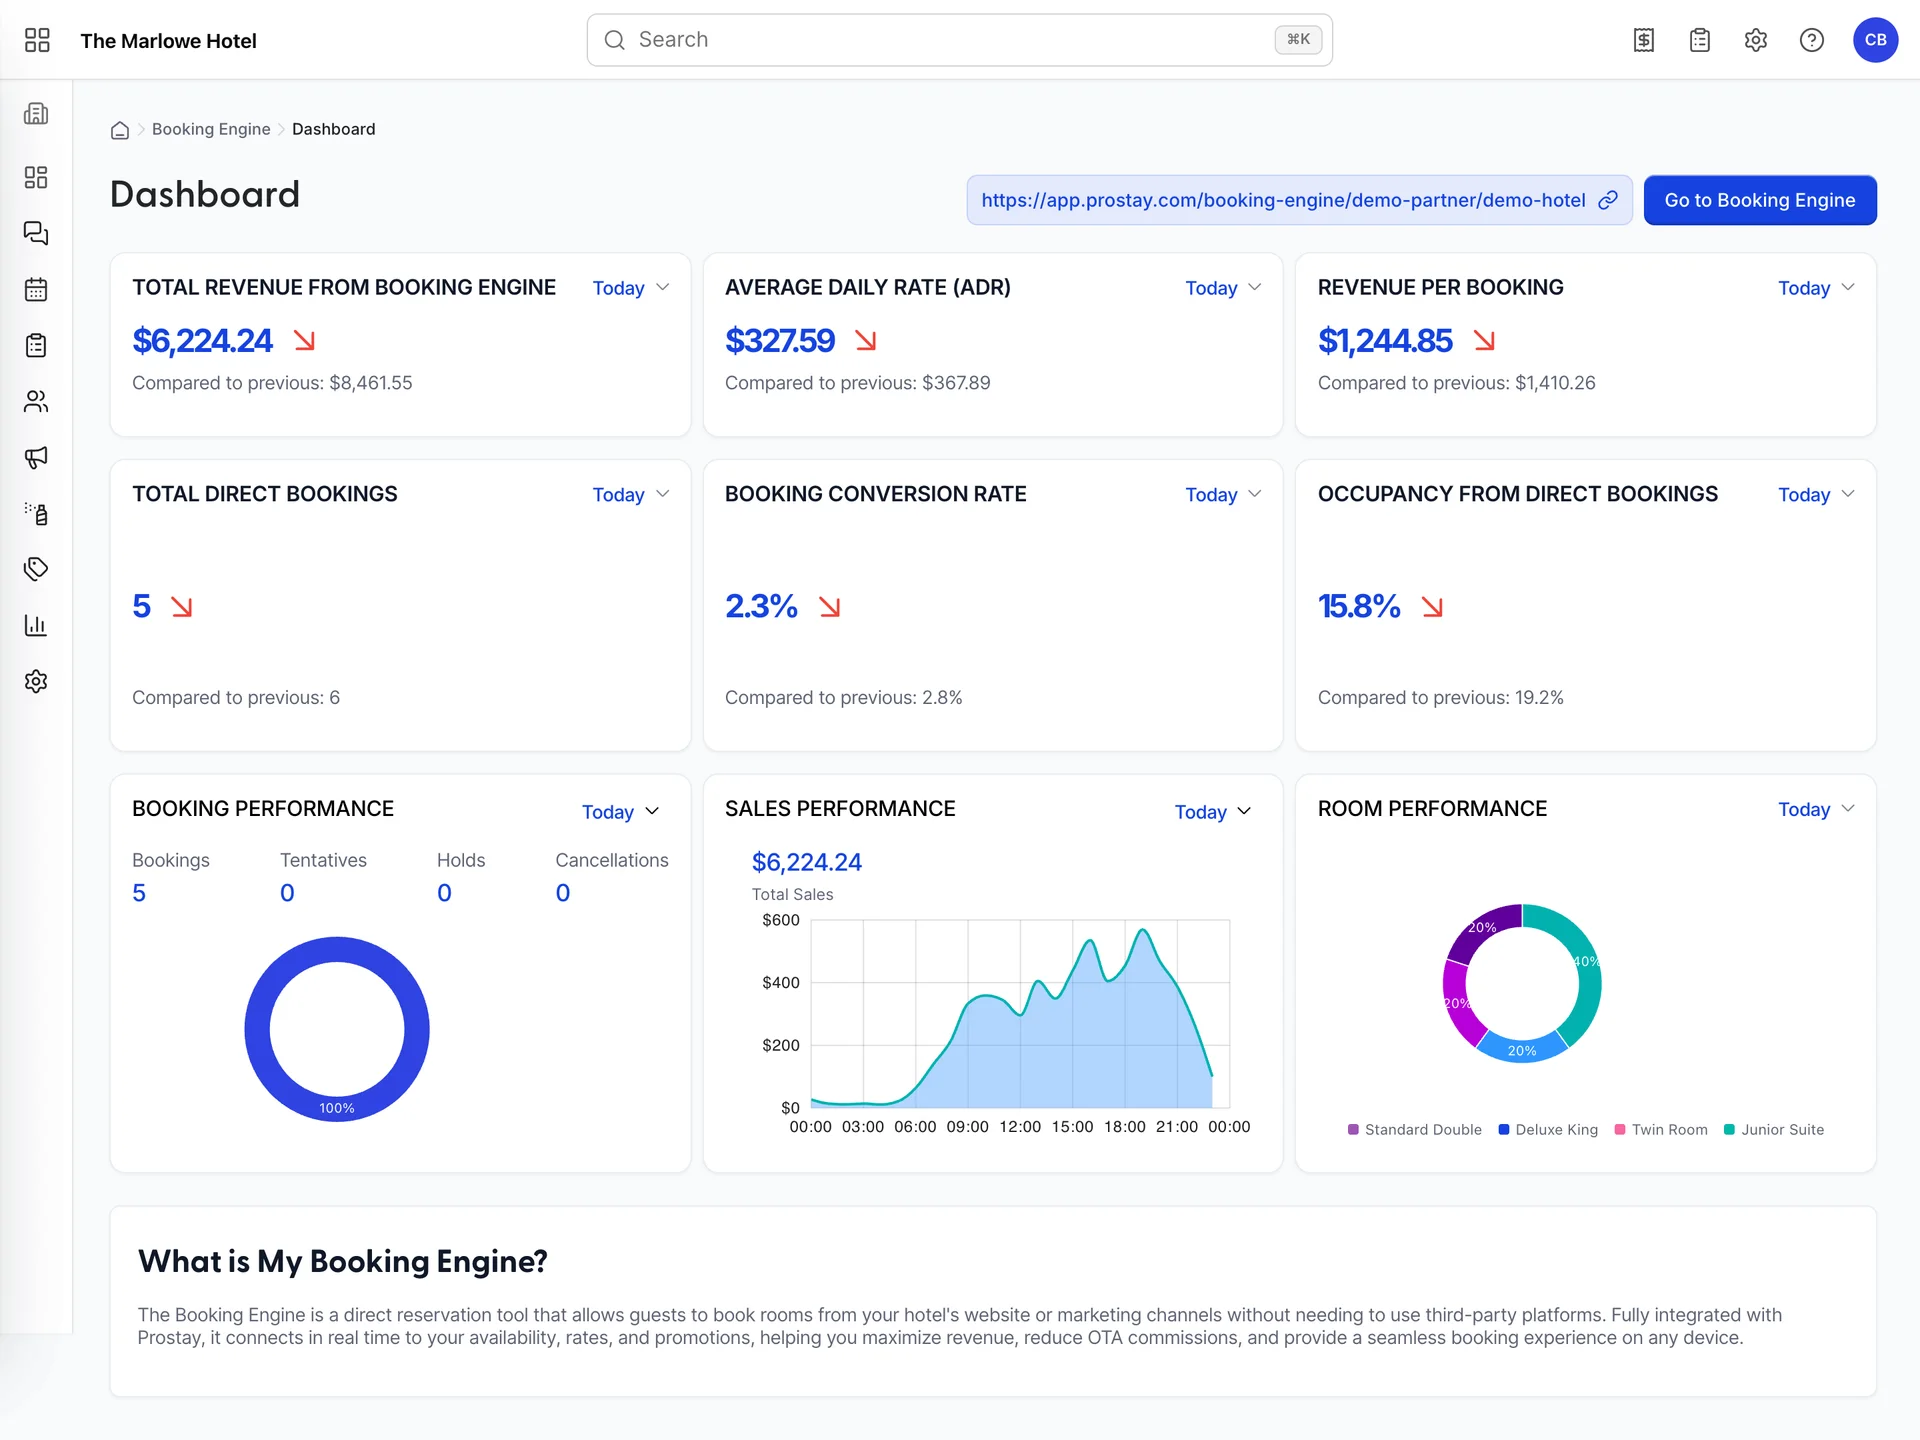
The chip holds the public address of your booking engine. This is the link you put behind the Book Now button on your website, in your email signature, on your Google Business Profile and in your confirmation emails. Click it to copy. The blue button opens the engine in a new tab, which is the fastest way to check that a settings change has landed.
The money tiles

- Total Revenue from Booking Engine. What your direct bookings sold in the window.
- Average Daily Rate (ADR). That revenue divided by the room nights it covered.
- Revenue per Booking. That revenue divided by the number of bookings.
| Tile | What it tells you |
|---|---|
| Total Revenue from Booking Engine | The headline. On its own it only says whether you had a good week, so read it against the comparison line rather than in isolation. |
| Average Daily Rate (ADR) | What you sold a room night for on average, direct. Compare it against your overall ADR: if direct is lower, you are discounting the channel that costs you least, which is usually a rate-plan mistake rather than a strategy. |
| Revenue per Booking | ADR multiplied by length of stay, in effect. It moves when guests book longer stays, take more rooms, or buy extras, so it is the tile that reacts to your add-ons and your minimum-stay rules. |
The arrow beside each figure compares the window you have chosen against the one before it: green and rising means up on the previous period, red and falling means down. Both are drawn from the same Compared to previous figure printed underneath, so if you want the size of the move rather than its direction, read the number.
The volume tiles

- Total Direct Bookings. How many reservations the engine took.
- Booking Conversion Rate. Those bookings as a percentage of visits to the engine.
- Occupancy from Direct Bookings. The share of your available room nights that direct filled.
| Tile | What it tells you |
|---|---|
| Total Direct Bookings | A count, not a value. It is the tile to watch after any change to your engine, because a change that helps will show up here before it shows up in revenue. |
| Booking Conversion Rate | Bookings divided by visits. This is the single most useful figure on the page, because it separates a quiet week from a broken engine: traffic you cannot control, conversion you largely can. |
| Occupancy from Direct Bookings | Room nights sold direct as a percentage of all the room nights you had to sell. Read against your total occupancy, this is your direct share of the house. |
The three panels
| Panel | What to look for |
|---|---|
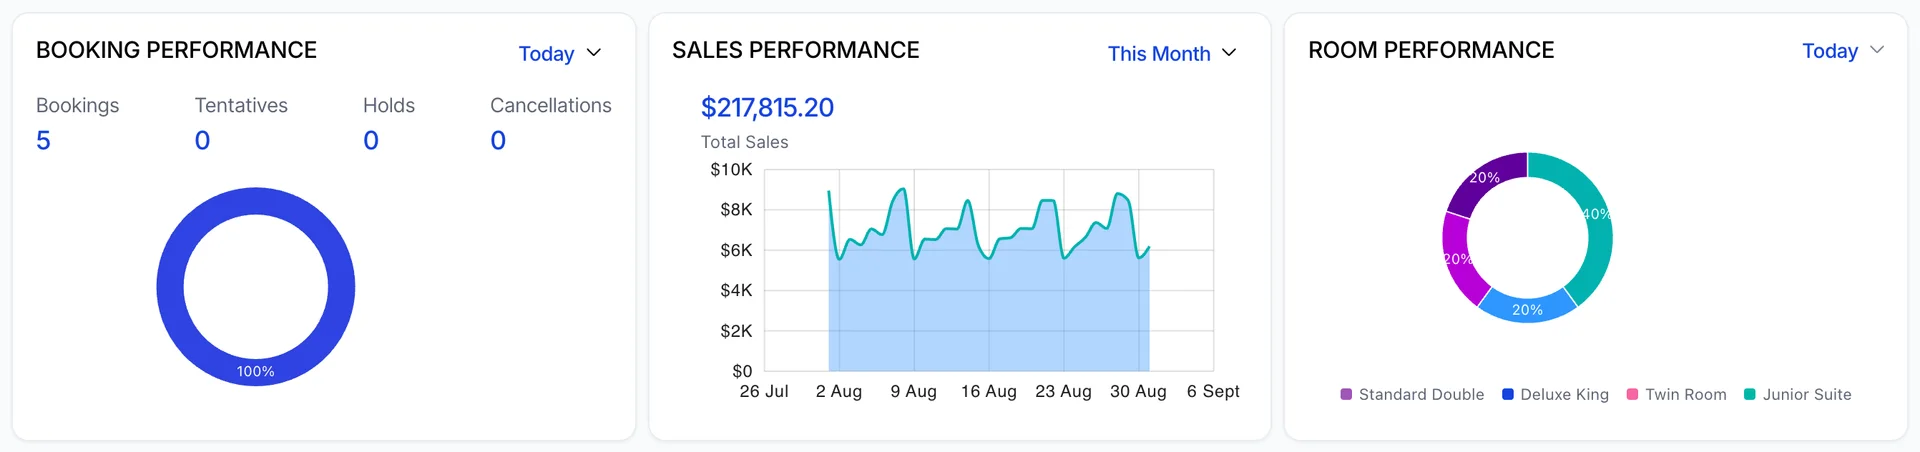
| Booking Performance | Confirmed bookings, tentatives, courtesy holds and cancellations, with the doughnut showing the split. A cancellation slice that keeps growing is worth chasing: it usually means a policy that is too loose, or rates being undercut somewhere after the guest has booked. |
| Sales Performance | Direct revenue over time, with the window's total above it. On a single day it is drawn hour by hour, which tells you when your guests actually book; on a month it is a daily line, which shows you your pickup pattern. |
| Room Performance | Which accommodation types the engine sold, as a share of bookings, with a colour key underneath. This is the panel that tells you whether your engine is selling your whole hotel or just its cheapest room. |
The Sales Performance total is the same figure as the Total Revenue from Booking Engine tile when both are set to the same window, so you can use one to check the other.
Room Performance is the panel most worth acting on. If one type takes the large majority of your direct bookings, it is usually your cheapest, and the fix is not to raise its price but to give the types above it a reason to be chosen: a photograph that shows the difference, a description that names it, a rate plan with breakfast in it. A guest who cannot tell what the extra $40 buys will not spend it.
Time frames and comparisons
Every tile and every panel carries its own time-frame dropdown, and they are independent. That is genuinely useful, since you can leave revenue on This Month while you look at conversion for Today, but it is also the most common way to misread this page: two tiles set to different windows are not comparable, and nothing on the screen warns you. Before you draw a conclusion from two figures, check that both dropdowns say the same thing.
Fourteen windows are offered, from Today to Last Year. Each one is compared against the equivalent period before it: This Month against Last Month, This Week against Last Week, Today against Yesterday. That is what Compared to previous means, and it is why the arrows are meaningful without your having to remember what last month's number was.
Reading it like a revenue manager
Two comparisons carry almost all the value on this page, and both need a second screen.
Direct ADR against total ADR. Your direct rate should be at least as high as your blended rate, because the guest booking with you directly is paying no commission and should not be getting a lower price for the privilege. If direct ADR is below your total, look for a promotion or a rate plan that is only exposed on the engine.
Direct occupancy against total occupancy. This is your direct share, and it is the number to move. Every point you take from an OTA is a point at full margin. If it has been flat for months while total occupancy has risen, your growth is coming from channels that charge you for it.
When conversion falls and traffic has not, the cause is almost always on the engine rather than in the market. Work through it in this order: search a date and see whether rooms actually appear, since a missing base rate interval or a zero allotment empties the list; check that your prices match what the OTAs are showing for the same night; then walk the funnel to the payment step and count how many fields you are asking a stranger to fill in.
All three of those live in the booking engine settings, which is where a number on this page turns into something you can change.