Klara Dvorakova showed me her trial balance over a video call in March 2026. The controller at a 92-room independent hotel in the Old Town district of Prague had been chasing a six-figure variance for eleven months. The number itself was 1.16 million Czech koruna, or roughly 48,000 dollars at the rate her accountant had used for the year-end statements. The variance was distributed across 14 separate accounts, none of them large enough on their own to surface in a routine review, all of them adding up to a real hole in the year-end P&L. Klara had been at the property for four years. The previous controller had handed off a chart of accounts that had been built in 2019 by an external accounting firm that had since moved out of hospitality entirely. The chart had not been audited against the property's actual posting patterns since.
The follow-up question was the one most operators stop short of asking. Where exactly was the 48,000 dollars hiding, and which of the variances were honest accounting timing differences versus real cash that had been quietly bleeding out of the P&L? Klara walked me through her variance ledger, organized by failure mode rather than by GL account. The pattern that emerged was specific. 18,400 dollars was sitting in a clearing account because Booking.com virtual-card refunds against expired cards had failed silently and the cash had been booked but never actually paid out to the guests, who had eventually filed chargebacks against subsequent stays. 11,200 dollars was the cumulative effect of tip-and-service-charge entries posted with the wrong tax flag for 14 months, the cumulative under-remittance to the Czech tax authority that the property would now have to pay back with interest. 7,800 dollars was OTA commission accruals that had posted to revenue gross but where the commission deduction had landed in the next period, which had distorted both months and which the auditor had flagged as a control weakness. The remaining 10,600 was a long tail of comp ledger entries where the comping authority was missing, manual journal corrections that had been entered by the night-audit cashier without controller approval, and one specific bug where a credit-card processing-fee allocation had been split across the wrong departments for 8 months. None of it was theft. All of it was accounting that had drifted from the actual operating reality. Prostay's hotel accounting software is built around the assumption that the night-audit-to-general-ledger pipeline should produce a clean trial balance every morning rather than a 14-day month-end reconciliation project, and the operational habits described in this article are the ones that keep that pipeline clean once the structural foundation is in place.
This article is the operational guide to how hotel accounting should actually work for independent hotels in 2026. It walks the night-audit-to-general-ledger pipeline most properties get wrong, the nine reconciliation failures that quietly bleed P&L, the six numbers most hotel accounting tools miscount, the seven month-end close failures that turn a three-day close into a fourteen-day close, the chart-of-accounts cleanup that hospitality-specific properties rarely inherit cleanly from a generic template, the integration decision between Xero, QuickBooks Online, SAP Business One, and Microsoft Dynamics 365 Business Central by property segment, the 30-day cleanup playbook to drop the close from fourteen days to three or four, and the role Prostay plays in closing the loop from a guest-facing folio entry to a clean GL posting without manual reconciliation. The honest version, the one that names which failures actually bleed cash and which ones look like errors but are accounting timing, is shorter and more operationally specific than the hotel-accounting literature most controllers have read. Numbers cited below are pulled from a sample of 27 independent hotels (40 to 240 rooms) across Europe, the UK, and North America for which we have month-by-month trial-balance data over the last 12 to 18 months, complemented by the Hospitality Financial and Technology Professionals (HFTP) Uniform System of Accounts for the Lodging Industry (USALI) 11th edition guidance and the 2025 USALI update on virtual-card and tokenized-payment posting.
Why hotel accounting is structurally harder than retail accounting
Hotel accounting is not retail accounting with rooms instead of products, and the differences add up to a structurally different posting flow that most generic accounting setups handle badly. Three differences matter most.
The first is multi-day revenue recognition. A hotel booking is a contract for a multi-night stay that produces revenue across multiple GL periods, and the right accounting treatment splits the revenue across nights rather than recognizing it all at booking or all at check-out. A guest who books on March 28 for a stay on March 31 to April 2 produces three nights of revenue, with one night posting to March and two to April. The deposit they paid on March 15 is a liability until it is earned, and it has to be released to revenue per night as the stay happens. Generic accounting templates typically treat this like a single-period sale and post the entire booking to revenue at one of three wrong moments (booking date, deposit date, check-out date), which produces month-end variances that the controller has to manually unwind. Properties that switch to night-by-night revenue recognition through a deferred-revenue control account see their period-to-period variance on rooms revenue drop by 70 to 90 percent and the audit-comment count at year-end drop by a similar margin.
The second is the parallel revenue and cost-of-sales structure. A hotel with a restaurant, a spa, and meeting rooms has at least four revenue streams (rooms, food and beverage, spa, banquets and events), each with its own cost of sales (housekeeping supplies and labor for rooms, food cost for F&B, retail product cost for spa, equipment-and-staff cost for events), and each with its own departmental P&L that the GM and the F&B manager and the spa director are running against. The right chart of accounts produces departmental P&Ls directly from the GL with no custom report build, by clustering revenue accounts (4000-series for rooms, 5000-series for F&B, 6000-series for spa, etc.) with parallel cost-of-sales accounts in the same series. Generic templates usually have a single revenue cluster and a single cost cluster, which forces the controller to build a manual mapping report every month to produce the departmental view, which is brittle, manual, and a recurring source of error. F&B charge posting in 2026 covers the F&B side of this structure in operational depth, including the HTNG-1A spec that determines how POS revenue actually lands in the GL.
The third is that the source of the revenue (direct, OTA, GDS, group, corporate) determines the cost-of-acquisition that has to be netted against the revenue to compute the channel-level contribution margin. An OTA booking carries a 15 to 25 percent commission that has to post somewhere, ideally to a contra-revenue or sales-discount account in the same revenue cluster so the net revenue per channel is computable directly. A direct booking carries a 1 to 3 percent payment-processing fee that should also map to a contra-revenue account rather than a generic banking expense. The generic chart of accounts does not have this structure, which means the controller has to do a manual channel-mix analysis every month to produce net revenue by channel, which is exactly the analysis the GM and the revenue manager need to make distribution decisions, and which is structurally hard to reproduce reliably without the right chart. Direct-booking conversion at hotels in 2026 covers the broader direct-booking economics that the channel-level posting underpins, and which the chart-of-accounts work either supports or obstructs.
None of this means hotel accounting is unfixable. The honest 2026 read is that the typical independent hotel chart of accounts has 6 to 12 specific weak points that an experienced hospitality controller can identify and fix in 8 to 16 hours of focused work, and that the structural fixes feed into the night-audit-to-general-ledger pipeline so the resulting GL is clean by morning rather than reconciled by hand at month-end. The right accounting tools support this, the wrong ones obstruct it, and the choice between them is the integration decision section later in this article.
The night-audit-to-general-ledger pipeline (and where it actually breaks)
The night-audit-to-general-ledger pipeline is the operational sequence that takes raw folio activity from the day, applies posting rules, generates a cash-balanced summary, and lands clean GL entries in the accounting system before the controller arrives at her desk in the morning. The pipeline runs in five stages. Most independent hotels have at least two of the five stages broken or missing, which is the structural reason the month-end close takes 11 days instead of 4. The version below is the 2026 reference version. Audit your own property against each stage.
Stage 1: Folio close at the PMS layer
The first stage is the daily folio close inside the PMS. At a defined time (usually between 23:00 and 02:00 local time), the night auditor freezes the day's posting activity, runs the daily balance routines, and locks the period. Folios that are still open (in-house guests staying multiple nights) carry forward, with the night's charges (room, tax, F&B charge-to-room, parking, incidentals) posted to each open folio and a daily-room-and-tax journal entry created. Folios that closed during the day (check-out, walk-out, cancellation) get finalized and posted to the daily-revenue summary. The night audit also reconciles the cash drawer at the front desk against the cash-handling log, posts any cash-paid-out journal entries (taxis, deliveries, refunds), and produces the daily cash sheet.
The failures at Stage 1 are mechanical. The night-audit clock not synchronized to the GL period (the PMS posts to the wrong day for transactions between 23:00 and 02:00 if the system time and the night-audit cutover are misaligned), folios that got reopened after close (which is usually the source of the most painful audit comments because reopening creates an out-of-sequence posting that breaks the immutability requirement), and rate-plan changes that posted retroactively after the audit ran (which produces a delta on the closed folio that has to be either recorded as a contra-entry or quietly ignored, and which most properties quietly ignore until month-end). Properties that audit Stage 1 quarterly typically find one of these issues active and the fix is mechanical (resync the clock, lock the close period, document the contra-entry workflow). Hotel pre-authorization versus deposits in 2026 covers the related question of how the deposit-versus-charge timing interacts with the daily folio close, which determines whether the cash on the books matches the cash in the bank.
Stage 2: Night-audit cash sheet generation
The second stage is the generation of the night-audit cash sheet, which is the daily document that summarizes the day's revenue by department, the cash collections by payment method (cash, credit card by brand, virtual card by OTA, bank transfer, deposit applied), the cash payouts, and the net cash balance for the day. The cash sheet is the primary source-of-truth document for the daily revenue posting to the GL, and most external auditors will ask to see a sample of cash sheets at year-end as part of the documentation review. The right cash sheet has departmental revenue lines (rooms, F&B, spa, banquets, retail, other), tax lines split by tax type and rate, payment-method lines that sum to total cash collected, and an opening-and-closing cash drawer reconciliation.
The failures at Stage 2 are usually format problems that look minor and produce real downstream variance. The cash sheet that aggregates F&B revenue without splitting between restaurant, bar, and room-service (which means the F&B departmental P&L cannot be computed without going back to the POS), the cash sheet that does not split credit-card receipts by card brand (which means the credit-card processing-fee allocation has to be done manually each month), and the cash sheet that puts virtual-card receipts into a single OTA bucket rather than splitting by Booking.com versus Expedia versus Agoda (which means the OTA-specific commission reconciliation runs against an aggregate rather than per-channel). Each of these collapses a level of detail the controller needs at month-end and forces a manual rebuild from the source data. The fix is to revise the cash-sheet template once and lock it as the standard, which most properties have not done since the original template was built years ago.
Stage 3: PMS-to-GL bridge mapping
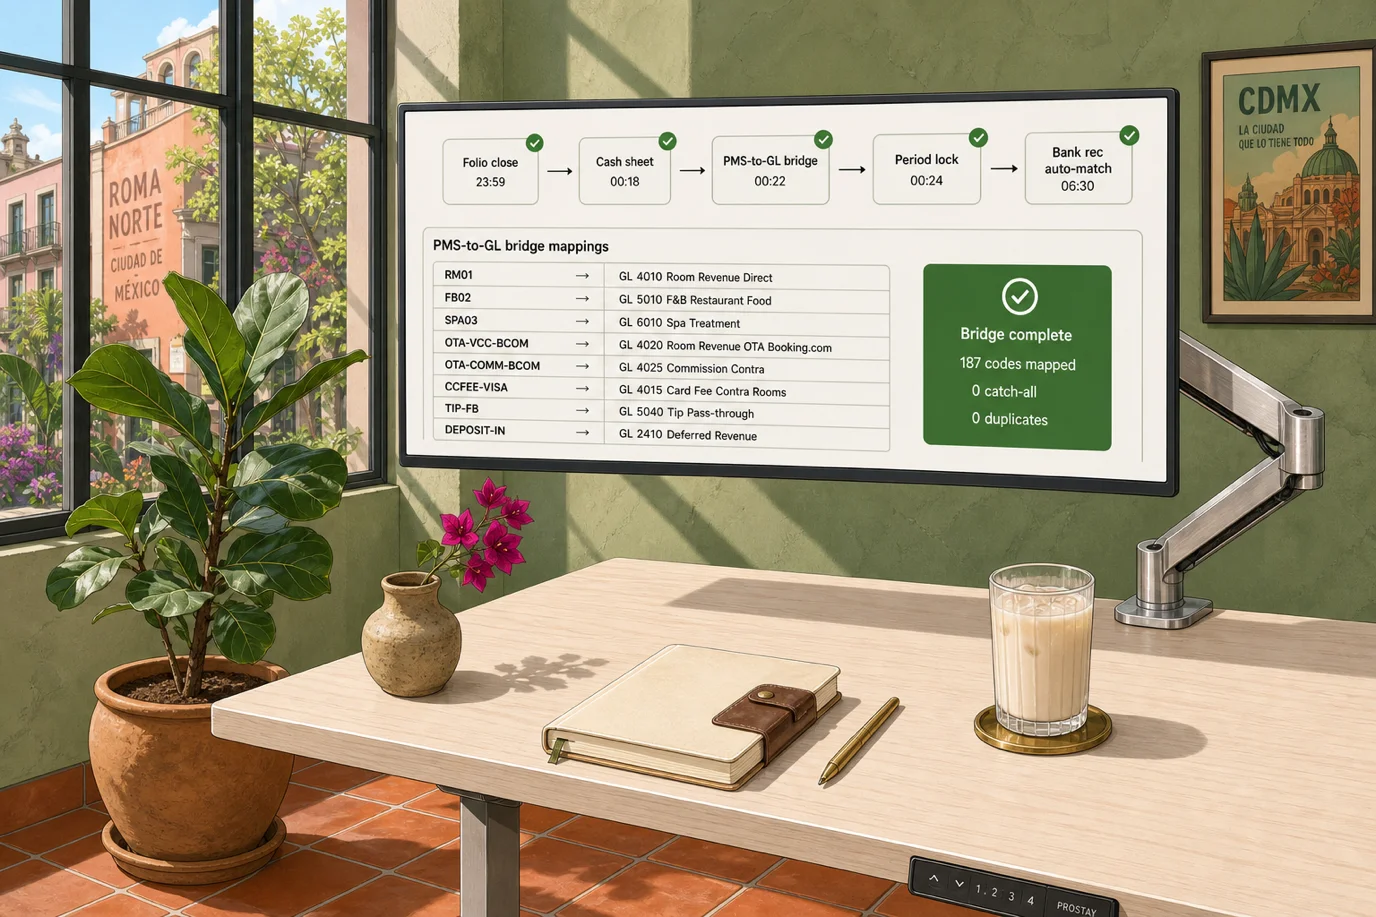
The third stage is the PMS-to-GL bridge, which is the mapping table that translates each PMS transaction code into a GL account number. A hotel PMS typically has 80 to 200 transaction codes (Room Revenue, Tax 1, Tax 2, Restaurant Food, Restaurant Beverage, Room Service, Mini-Bar, Spa Treatment, Spa Retail, Telephone, Parking, Pet Fee, Resort Fee, Cleaning Fee, Late Check-Out Fee, etc.) and a chart of accounts with 200 to 600 GL accounts depending on the property's sophistication. The bridge is the table that says, for example, that PMS code RM01 (Room Revenue) maps to GL account 4010 (Room Revenue, Direct Channel), or that PMS code FB02 (Restaurant Food) maps to GL account 5010 (F&B Revenue, Restaurant, Food). The bridge has to be complete (every PMS code maps to something), unique (each code maps to exactly one GL account), and correct (the mapping reflects the actual revenue type rather than what was easy to set up).
The failures at Stage 3 are the highest-yielding ones to fix because they propagate through the entire downstream pipeline. The most common failure is the catch-all GL account where unmapped PMS codes land (typically a single account named Other Revenue or Misc Income), which absorbs misposted transactions that should have been categorized properly and which is the single most common source of unexplained P&L variance at month-end. The second is duplicate mapping where two PMS codes map to the same GL account (Restaurant Food and Bar Food both mapping to F&B Revenue without further breakdown), which collapses detail that the F&B manager needs and which has to be reconstructed manually. The third is mapping drift where a new PMS code was added (a new resort fee, a new ancillary charge, a new package component) but the bridge was not updated, so the new code defaults to the catch-all and produces silent unmapped revenue. The cleanup is mechanical and takes 2 to 4 hours with the controller and the night auditor in the room together going through every PMS code and verifying the mapping. Properties that do this once typically find 8 to 20 misconfigured mappings and the resulting GL produces dramatically less variance month over month.
Stage 4: GL posting and period lock
The fourth stage is the actual GL posting. The night-audit summary, with the bridge applied, generates a journal entry that posts to the GL. The right journal entry is balanced (debits equal credits), dated to the correct period (the day the activity occurred, not the day the audit ran), tagged with a unique reference that links back to the source night audit, and locked once posted. The lock is the immutability requirement that external auditors look for, and the post-and-contra discipline is what protects the audit trail.
The failures at Stage 4 are concentrated in two patterns. The first is the editable-after-posting pattern, where the controller or the night-audit cashier can edit a journal entry after it has been posted. This is the most common audit-comment failure mode, and the 2025 USALI update flagged it as a material control weakness for any hotel with more than 50 rooms or more than 5 million in annual revenue. The fix is to enforce post-and-contra discipline at the accounting-software level, which most modern accounting tools support but which most properties have not turned on. The second is the period-not-locked pattern, where transactions can post to a closed period after the close has been finalized, which means the trial balance changes after the controller has already produced the financial statements for the period. The fix is to lock the period as part of the close routine and to require a controller-approved override for any post-period adjustment, with the override flagged in the audit log.
Stage 5: Bank reconciliation to GL
The fifth stage is the bank-to-GL reconciliation, which closes the loop between the GL cash account and the actual bank balance. The right cadence is daily for cash, weekly for credit-card settlements, and monthly for OTA virtual-card settlements (because OTA settlement runs on weekly or biweekly cycles). The reconciliation matches each bank deposit against the corresponding daily cash sheet, each credit-card settlement against the corresponding daily card receipt, and each OTA settlement against the corresponding bookings list. Variances are flagged and investigated within 72 hours of detection rather than queued for month-end.
The failures at Stage 5 are usually cadence failures rather than process failures. The reconciliation that runs only at month-end accumulates a backlog of unmatched transactions that takes 4 to 8 hours to clear and that produces month-end pressure the team does not need. The reconciliation that runs daily, with exceptions cleared inside 72 hours, produces a continuously-clean cash position and a month-end that is mostly already closed by the time the close routine runs. Reducing chargebacks by 60 percent covers the related chargeback-side reconciliation, where chargeback notices have to be tied back to the original transaction and the original night-audit posting, which is one of the more painful failure modes when the bank-to-GL reconciliation has been deferred to month-end. Prostay's booking engine and Prostay Pay together produce the daily settlement-and-reconciliation feeds that make Stage 5 a 10-minute morning task rather than a 4-hour month-end project.
The nine reconciliation failures bleeding P&L
The nine failures below are the patterns we see in audits of independent hotel accounting flows in 2026, ranked roughly by the cumulative dollar impact at a typical 60 to 120-room property. Most properties have at least four of the nine active at any moment, and the cumulative drag from running with all nine unaddressed for 12 months can be 0.4 to 1.8 percent of annual revenue, which at a 92-room property doing 4 million in revenue is 16,000 to 72,000 dollars a year. The fixes are mechanical, but they require sitting down with the controller, the night auditor, and the GM in the same room and going through each one against the actual posting flow, which is the kind of focused work most properties never schedule.
Failure 1: Virtual-card commission netting period mismatch
The single most common reconciliation failure in 2026 is the virtual-card commission netting mismatch. Booking.com, Expedia, and Agoda all settle bookings using virtual credit cards, where the OTA funds a virtual card for the booking value and the hotel charges the card on or after check-in. The OTA deducts its commission before settlement (or in some configurations, after), and the actual cash received by the property is the booking value minus the commission. The night audit at most independent hotels posts the gross booking to revenue and the commission to a separate expense account, which is correct in principle, but the timing usually breaks the reconciliation.
The break happens because the gross booking posts on the night of stay (the day the folio closes for that guest), while the commission deduction posts on the day the OTA settlement statement arrives, which can be 14 to 60 days later. For 14 to 60 days, the books show revenue that is higher than the cash, by exactly the cumulative commission amount, and the controller has to either accrue the commission as a liability at month-end (the right answer) or carry the variance until the OTA statement arrives (the easy but wrong answer). Properties that carry the variance produce monthly P&Ls where the commission expense is lumpy month over month, with no commission in the booking month and a large commission expense in the settlement month, which makes the channel-mix analysis unreliable. The fix is to accrue the commission at posting based on the contracted commission rate per channel, post it to a contra-revenue account in the same revenue cluster, and reverse the accrual when the actual settlement lands. The work is mechanical and takes a controller-and-night-audit pair about 2 hours to set up correctly. Hotel rate parity in the EU in 2026 covers the broader rate-parity context that determines what the gross-net split actually is per channel, which is the upstream variable that determines the right commission accrual rate.
Failure 2: Tip and service-charge tax treatment drift
The second failure is tip and service-charge tax treatment, which varies dramatically by jurisdiction and which most generic accounting templates handle incorrectly. The two key distinctions are between a tip (a voluntary gratuity paid by the guest to the staff member) and a service charge (a mandatory charge added by the property and either kept by the property or distributed to staff per policy), and between an automatic gratuity (a service charge added on parties of 6 or more, common in F&B) and a discretionary tip. The tax treatment differs across all four categories. In most US states a tip is not subject to sales tax, while a service charge is. In most EU jurisdictions the rules are similar but the VAT treatment is what matters. In the UK, tips processed through the property are subject to PAYE if the property holds the cash even briefly. The right chart of accounts has separate accounts for tips, service charges, and automatic gratuities, with tax flags configured per jurisdiction.
The failure is that most properties collapse these into a single Tip and Gratuity account with a single tax flag, which means a fraction of transactions get the tax treatment wrong and the cumulative under-remittance or over-remittance to the tax authority builds up over months. At a property with a busy F&B operation doing 200,000 dollars of F&B revenue per quarter with 18 percent average gratuity, the tip-and-service-charge volume is 36,000 per quarter, and a 5 to 8 percent tax-flag error rate produces 1,800 to 3,000 of mis-handled tax per quarter. Compounded over 12 months, that is 7,000 to 12,000 of either back-tax owed or over-paid tax that has to be reclaimed. The fix is to split the chart, configure the tax flags correctly per jurisdiction, train the F&B team on which charge type applies to which receipt format, and run a quarterly review against the POS data. The 2025 USALI update added explicit guidance on tip-and-service-charge categorization that most legacy charts do not yet reflect.
Failure 3: Comp and house-account ghost charges
The third failure is the comp ledger and house-account flow. A hotel comps charges (free room nights for VIPs, complimentary meals for regulars, owner stays, employee discounts) by posting the charge to the folio at the standard rate and then crediting the comp amount to a contra-revenue account, which records the gross revenue and the comp expense separately so the GM can see the comping volume. The house account is the corollary, where charges that need to be paid by the property itself (executive lunches, marketing meals, training expenses) get charged to a designated house folio rather than billed to a guest, which the controller then settles against the right expense category at month-end.
The failure is that the comp authority and the house-account categorization are usually weak controls. Comp entries get posted without a documented authorizer (which means at year-end the controller has 200 comp entries and no signature trail, which the auditor flags), and house-account charges land in a generic Owner Expense or Promotional Expense bucket without further categorization, which collapses information the controller and the GM need. The cumulative impact is harder to measure than the OTA or tip failures because the dollar amount is smaller (typically 0.5 to 1.5 percent of room revenue and a similar fraction of F&B), but the audit-trail weakness usually produces an audit comment that costs more in remediation work the following year than the underlying dollar impact. The fix is to enforce comp authority at the PMS level (every comp requires a manager-or-above PIN), to categorize house-account charges with a 3-to-5-bucket dropdown at the time of posting, and to review the comp ledger weekly rather than at year-end.
Failure 4: Late-arrival, no-show, and walk-in cash-drop confusion
The fourth failure is the cash-handling at the late-night front desk, where arrivals after 22:00, no-show charges, and walk-in cash payments interact with the night-audit cutover in ways that are operationally unclear and that produce posting errors at a small but consistent rate. A walk-in guest who pays cash for a single night at 23:30 is a transaction that should post to that day's revenue, but if the night audit has already started, the payment may post to the next day or to a manual journal entry that lands in the wrong period. A no-show charge applied at 02:00 (after the 24-hour cancellation window passes) should post to the day the reservation was for, but most PMSes will date it to the day the charge was actually applied, which is the next day. A late-arrival guest who checks in at 00:30 and immediately pays with a card is a transaction that may have the correct revenue date but the wrong settlement date if the auth happened in one period and the capture in another.
The cumulative dollar impact at a busy urban independent property is usually 0.2 to 0.5 percent of room revenue per year, which is small but which produces a consistent month-over-month variance that the controller has to manually unwind. The fix is to align the night-audit cutover time with the actual operational pattern (a property that gets most arrivals between 16:00 and 22:00 should run the audit at 02:00 with a documented exception process for the rare arrivals between 23:00 and 01:00) and to train the night-audit cashier on the specific posting rules for late arrivals, no-shows, and walk-ins. The training takes an hour. The check is a quarterly review of the late-night posting log against the day-of-arrival folios.
Failure 5: Credit-card processing-fee allocation
The fifth failure is the credit-card processing-fee allocation. Credit-card processors charge a fee per transaction that is typically 1.5 to 3 percent of the transaction value, and the right accounting treatment posts the fee to a contra-revenue account in the same revenue cluster as the transaction. A 200-dollar room charge processed on a card with a 2.4 percent fee should post 200 dollars to room revenue and 4.80 dollars to a contra-revenue or sales-discount account that nets against room revenue, so the GM can read the net revenue per channel without doing the math.
The failure is that most generic charts post all credit-card fees to a single Banking Fee or Merchant Service Fee expense account, which loses the channel-and-department detail and which has the wrong sign for the GM's departmental P&L view. A hotel with rooms revenue, F&B revenue, and spa revenue should have three credit-card-fee contra-revenue accounts, each netting against the corresponding revenue cluster, so the departmental net revenue is computable directly. The cumulative volume is real. At a 92-room property doing 4 million in revenue with 65 percent of payments on cards at a blended 2.2 percent fee, the credit-card fee volume is 57,000 per year, and the wrong allocation distributes it as a single banking-fee number rather than as net revenue impact per department. The fix is mechanical (split the contra-revenue accounts, configure the payment-processor mapping, train the controller on the new treatment), and it produces dramatically more useful departmental P&L for ongoing operational decisions. Prostay Pay ships the per-transaction fee allocation as a first-class feature, with the fee mapped to the transaction's revenue category at posting rather than aggregated at month-end.
Failure 6: Housekeeping supply expense allocation
The sixth failure is the cost-of-sales allocation for housekeeping supplies. The right accounting treatment for housekeeping supplies (sheets, towels, toiletries, cleaning supplies, paper goods) is to recognize the expense as a cost of room sales, allocated by occupied room nights, which makes the cost-per-occupied-room number computable directly from the GL and which lets the GM track cost-per-room over time as a key operational metric.
The failure is that most properties expense housekeeping supplies at the time of purchase rather than at the time of use, which produces lumpy expense recognition (a large purchase order in March produces a large expense in March even if the supplies are used over the following 6 months) and which makes cost-per-occupied-room hard to compute without a manual inventory-and-allocation analysis. The right treatment is to post supply purchases to an asset account (Housekeeping Supplies Inventory), do a quarterly inventory count, and book the cost-of-supplies-used as a periodic adjustment based on the inventory delta and the occupancy data. This is HFTP USALI 11th edition standard treatment for properties above a size threshold, and it is what external auditors increasingly expect. The cumulative impact at a 92-room property is roughly a 0.3 to 0.7 percent variance on rooms cost-of-sales over the year, which is small in absolute terms but which produces persistent departmental P&L noise that the GM cannot read through. The fix takes a controller and the housekeeping director half a day to set up and quarterly inventory counts of 1 to 2 hours thereafter.
Failure 7: Deferred revenue aging
The seventh failure is deferred revenue aging. When a guest pays a deposit at booking for a future stay, the deposit is a liability (the property owes the guest a service) until the stay happens, at which point the deposit is earned and converted to revenue. The right accounting treatment posts the deposit to a Deferred Revenue liability account at receipt, ages the deferred revenue by stay date, and converts the deferred revenue to actual revenue night-by-night during the stay.
The failure is that most generic charts have a single Deferred Revenue account with no aging structure and no automated conversion to revenue at the right time. The deposits sit in the deferred-revenue bucket indefinitely, and the controller has to do a monthly journal entry that releases earned deposits to revenue, which is a manual process with a 10 to 20 percent error rate at most properties. The cumulative impact is that a property running a deposit-on-booking model has 4 to 12 weeks of deposit liability on the balance sheet at any given time, with 20 to 40 percent of that liability technically already earned but not yet released to revenue. At a 92-room property doing 4 million in revenue with 30 percent of bookings on deposit, the deposit liability is roughly 200,000 to 400,000 at any moment, with 40,000 to 160,000 technically already earned but stuck in the liability account. The P&L impact is a deferred recognition of revenue that flatters this period and inflates the next. The fix is to age the deferred revenue by stay date, configure an automated daily release that converts earned deposits to revenue, and reconcile the deferred-revenue balance against the active reservations list weekly.
Failure 8: Control-account-versus-detail-account mismatch
The eighth failure is the control-account structure of the GL, which is the discipline of having a small set of summary accounts (control accounts) that aggregate detail from a larger set of detail accounts, and ensuring that the control-account balance always equals the sum of its detail-account balances. The most common control accounts in a hotel chart are Accounts Receivable Control (which aggregates the city-ledger detail by guest or company), Accounts Payable Control, Folio-in-Progress Control (the in-house guest folio total), and Inventory Control.
The failure is that the control-account discipline is rarely enforced at independent hotels, which means the AR Control balance and the sum of the city-ledger detail balances drift apart over time, with the difference representing transactions that posted to detail without posting to control or vice versa. A 92-room property doing 800,000 of city-ledger A/R (corporate accounts, group masters, OTA receivables) typically has a control-to-detail variance of 1,000 to 4,000 by year-end if the discipline has not been enforced, which is the kind of variance that an external auditor will dig into and that requires a multi-hour reconciliation to clear. The fix is to enforce the control-account-equals-detail-account check in the night-audit close, which most modern accounting tools support but which most properties have not turned on, and to fail the close (require a controller intervention) if the check fails. PCI DSS 4.0 compliance for hotels covers the related discipline on the payments side, where similar control structures protect the cardholder data environment from drift over time.
Failure 9: Inter-period adjustments without audit trail
The ninth failure is inter-period adjustments without a documented audit trail. Hotels sometimes need to make adjustments to closed periods (a refund processed in May for a stay that occurred in April, an OTA settlement that lands two periods after the booking, a tax correction filed for a previous quarter), and the right discipline is to post these as contra-entries with a clear reference to the original transaction and a documented authorization.
The failure is that most properties allow controller-level edits to closed periods without an audit trail, which means the trial balance for a closed period can change after the financial statements have been issued. This is the single most material control weakness external auditors look for, and it is the failure mode that produces the highest-friction audit comments. The 2025 USALI update made the audit-trail requirement explicit and most external hotel-audit programs now check it as a standard procedure. The fix is to enforce post-and-contra discipline at the accounting-software level (no edits to posted entries, only contra-entries with a documented reason), to lock closed periods at the controller-level, and to require dual authorization for any post-period adjustment above a defined materiality threshold (typically 500 to 2,000 dollars). Properties that adopt this discipline see audit fees drop by 20 to 35 percent the following year because the auditor spends less time investigating the audit trail.
The six numbers most hotel accounting tools miscount
Hotel accounting tools in 2026 expose a set of metrics that look right at first glance but that are computed in subtly wrong ways for a hospitality operation. The six numbers below are the corrected versions, the ones that actually correlate with operational truth and that survive an external audit. The point of switching to these six is not metric pedantry, it is to surface what is actually moving in the business so the GM, the controller, and the revenue manager are looking at the same data when they make decisions. Each one of these is a 1-to-4-hour fix at the chart-of-accounts level, and the cumulative effect over a year is a P&L that the team can read without translation.
Number 1: Rooms revenue net of commission, not gross
Most hotel accounting reports show rooms revenue gross, with commission as a separate expense line below the revenue cluster. The number is technically correct as a gross-to-net presentation, but it loses the channel-mix story that the GM and the revenue manager actually need. The right metric is rooms revenue net of channel-specific commission, broken down by channel (direct, OTA-Booking.com, OTA-Expedia, OTA-Other, GDS, group, corporate), so the contribution per channel is computable directly from the GL with no manual mix analysis.
The structure that produces this is a contra-revenue account per channel in the same revenue cluster as the gross revenue, so the GL Revenue cluster nets to the contribution-margin number directly. A typical hotel chart in 2026 has 4010 (Room Revenue, Direct), 4020 (Room Revenue, OTA-Booking.com), 4025 (Room Revenue, OTA-Booking.com Commission, contra), 4030 (Room Revenue, OTA-Expedia), 4035 (Room Revenue, OTA-Expedia Commission, contra), and so on. The sum of the cluster gives the net rooms revenue. The right report shows the gross, the commission contra, and the net per channel side by side, which is the analysis the revenue manager needs to make distribution decisions and which the chart structure either supports or obstructs.
Number 2: Departmental cost-of-sales allocated by occupancy
Most hotel accounting reports show cost of sales as a single number per department for the period (rooms COGS for the month, F&B COGS for the month). The right metric is departmental cost-of-sales per occupied room night for rooms, per cover for F&B, per treatment for spa, which controls for the operational denominator and which is the number the department head actually uses to track operational efficiency over time.
The structure that produces this requires the COGS to be allocated by the operational denominator at the GL level, which most generic charts do not support natively. The workaround at most properties is a monthly manual report that pulls COGS from the GL, occupancy from the PMS, covers from the POS, and computes the per-unit cost. The work is mechanical but it adds 2 to 3 hours per month per department. The clean version configures the GL to post operational denominators alongside the financial entries, which most modern hospitality accounting tools support and which makes the per-unit cost computable directly from the GL without a manual mix.
Number 3: Deferred revenue aged by stay date
Most hotel accounting reports show deferred revenue as a single liability balance with no aging. The right metric is deferred revenue aged by stay date, with buckets for the next 30 days, 30 to 90 days, 90 to 180 days, and 180-plus days, so the controller can see the cash-flow profile of the deposit liability and can flag any deposits that have aged past their corresponding stay date (which is a refund-or-revenue-recognition trigger).
The aging structure is what protects against the silent build-up of deferred revenue that has technically already been earned. A property doing a 30-percent-deposit-on-booking model has roughly 4 to 12 weeks of deposit liability on the balance sheet at any time, and the aging report tells the controller exactly which fraction is still future-dated and which fraction should already have been released to revenue. Properties that run the aging report monthly catch their own deferred-revenue release errors before the auditor does, which avoids the year-end adjustment and the corresponding audit comment.
Number 4: Occupied-room-night cost of acquisition by channel
Most hotel accounting reports do not produce a cost of acquisition (CAC) per channel directly. The number has to be computed from a manual analysis of marketing spend, OTA commission, paid-search spend, metasearch spend, and content production cost, allocated to channels, and divided by occupied room nights per channel. The right structure produces this directly from the GL.
The chart-of-accounts work is to map each acquisition expense (marketing, paid search, metasearch, content, OTA commission contra-revenue, GDS fee, channel-manager subscription) to the channel cluster it serves, with a per-channel CAC computable from the cluster total divided by the bookings volume in that channel. The numerator is in the GL. The denominator is in the PMS. The right report joins them at the channel-cluster level and produces a per-channel CAC that the revenue manager can use to make budget allocation decisions. Hotel metasearch bidding in 2026 covers the metasearch side of this question, where the per-bid attribution interacts with the chart-of-accounts mapping to determine whether the channel actually pays for itself.
Number 5: Flow-through and flex
Flow-through is the percentage of incremental revenue that converts to incremental gross operating profit (GOP), and it is one of the most important hospitality-specific metrics for understanding whether revenue growth is actually producing profit growth. A property where flow-through is 60 percent is converting 60 cents of every incremental revenue dollar to GOP. A property where flow-through is 30 percent is leaking incremental revenue to incremental cost. Flex (sometimes called flex-down) is the corresponding metric on the way down, the percentage of revenue decline that converts to GOP decline.
The failure at most independent hotels is that flow-through is computed as a single number for the period rather than broken down by department or by revenue type. A property running a healthy 65 percent flow-through on rooms but a 15 percent flow-through on F&B is being told a blended flow-through of around 50 percent, which obscures the operational truth that the F&B team needs intervention while the rooms team is performing well. The right structure produces flow-through per revenue cluster, computed from the cluster-level revenue and cost-of-sales movement period over period. The chart-of-accounts work to support this is small once the cluster-level structure is in place from Number 2 above. The 2025 USALI update added explicit flow-through guidance that most legacy reports do not yet implement.
Number 6: Net non-rooms revenue as a percentage of total
The sixth metric is the non-rooms revenue percentage, which is the share of total revenue coming from F&B, banquets, spa, retail, and other ancillary streams rather than from rooms. The metric is a useful indicator of how diversified the revenue base is and how the property is performing on cross-sell, upsell, and ancillary monetization. Properties with healthy non-rooms revenue percentages (typically 25 to 45 percent for a full-service independent) are less exposed to seasonal rooms-demand fluctuations and have more operational levers to pull when rooms revenue softens.
The failure is that most properties compute the metric on gross revenue rather than on net (after commission and contra-revenue), and the gross figure is misleading because rooms revenue gross-to-net erosion is much higher than F&B gross-to-net erosion. A property where rooms is 70 percent gross might be 65 percent net after OTA commission and credit-card fees, while F&B might be 30 percent gross and 28 percent net. The gross ratio says rooms is the dominant revenue source, the net ratio shows that rooms is even more dominant on a net basis because of the higher gross-to-net erosion. The fix is to compute the metric on net revenue once the contra-revenue structure from Number 1 is in place, which gives the GM the actually-useful version. Hotel booking abandonment recovery in 2026 covers the related question of how recovered direct bookings affect the channel mix, which feeds into both the gross-to-net calculation and the non-rooms-revenue percentage if the recovery channels also drive ancillary attach.
The seven month-end close failures
The month-end close at most independent hotels is the single most predictable accounting friction point in the calendar. The 27-property sample we use in this article had a median close of 11 working days and a 75th percentile of 14, against a best-practice target for properties of this size of 3 to 5 days. The seven failure modes below are the patterns that drive the slow close. Three of them are upstream pipeline failures that propagate to month-end. Four of them are close-routine failures specific to the close itself. They compound. A property running with five of the seven active will close in 12 to 16 days regardless of how much overtime the controller works, because the friction is structural rather than effort-related.
Close failure 1: No soft-close discipline during the month
The first close failure is the absence of a soft-close discipline through the month. The right rhythm runs a soft close every Monday morning, where the controller reviews the prior week's revenue postings, checks the bank-reconciliation status, clears any open exceptions from the night-audit log, and validates that the trial balance is in agreement. The soft close takes 30 to 60 minutes a week and produces a continuously-clean GL state where month-end is mostly already closed by the time the close routine runs.
The failure is that most independent hotels do not run a soft close, the controller looks at the GL only at month-end, and any exception that occurred in week one of the month is being investigated four weeks later, by which point the operational context (which guest, which posting, which OTA settlement) has degraded and the investigation takes much longer than it would have at the time. The fix is to schedule the soft close on the controller's weekly calendar as a non-negotiable 60-minute block, document the checklist (bank rec status, night-audit exceptions, OTA settlement reconciliation, deferred-revenue release, trial-balance agreement), and run it without exception for two months. The compounding effect is that month-end goes from 11 days to 6 days within two cycles purely from the soft-close discipline, with no other change.
Close failure 2: Bank reconciliation deferred to month-end
The second close failure is bank reconciliation that runs only at month-end rather than daily for cash and weekly for cards. Daily and weekly cadence catches discrepancies inside the operational window where they can be investigated quickly. Monthly cadence batches them into a single 4-to-8-hour reconciliation project at month-end, with backlog of unmatched items that take longer to resolve the older they are. The cumulative time impact at a 92-room property is 6 to 10 hours of avoidable month-end work per cycle, which scales linearly with property size.
The fix is to schedule the bank-rec on the controller's daily routine for cash and weekly routine for cards, configure auto-match rules in the accounting tool for the high-volume routine matches (each daily cash deposit matches the corresponding cash sheet, each daily card settlement matches the corresponding card receipts), and clear exceptions inside 72 hours of detection. Most modern accounting tools support auto-match rules, and most properties have not set them up because the original implementation was done by an external accountant who left without configuring the automation. The set-up takes 2 to 3 hours with the controller and produces a continuous-reconciliation flow that drops the close timeline by 3 to 6 days on its own.
Close failure 3: OTA settlement reconciliation deferred to year-end
The third close failure is OTA settlement reconciliation that the controller runs only at year-end rather than monthly. OTA settlement statements (Booking.com, Expedia, Agoda, the GDS chains) arrive on a weekly or biweekly cadence with the gross bookings list, the commission deduction, the net settlement amount, and any disputed bookings or refunds. The right discipline is to match each settlement against the corresponding bookings from the PMS within a 30-day window, flag any variance, and clear the variance inside the next 30 days.
The failure is that most properties do not run the monthly OTA-settlement reconciliation and discover at year-end that 0.5 to 2 percent of OTA bookings have variance against the property's records, with the variance reflecting either disputed bookings the property never investigated, settlement errors the OTA never corrected, or commission overcharges the property never disputed. The cumulative dollar impact at a 92-room property doing 30 percent of bookings through OTAs is typically 3,000 to 12,000 per year of variance that the property would have caught and recovered if the reconciliation had run monthly. The fix is to add the monthly OTA reconciliation to the controller's checklist, with the dispute window noted (Booking.com is 60 days from settlement, Expedia is 90, Agoda is 90), so any variance that has not been investigated and disputed inside the window is a cash loss the property cannot recover.
Close failure 4: Manual journal entries pending controller approval
The fourth close failure is the queue of manual journal entries waiting for controller approval that piles up through the month and lands as a 2-to-5-hour review project at month-end. Manual entries are a normal part of any accounting close (accruals, deferrals, reclassifications, corrections), but the right cadence approves them as they happen rather than batching them. A controller who reviews and approves manual entries within 24 hours of submission keeps the approval queue at zero and prevents the month-end pile-up.
The failure is that most independent hotels do not enforce the 24-hour approval discipline, manual entries accumulate through the month, and the controller spends a chunk of month-end day one or two reviewing the backlog rather than running the close. The fix is straightforward operational discipline (block 30 minutes a day for entry review and approval), with a tooling assist (the accounting tool sends a daily digest of pending entries) that keeps the queue visible. The cumulative time saving at month-end is 2 to 5 hours per cycle, plus the secondary benefit that controller-approved entries posted promptly produce a cleaner trial balance through the month.
Close failure 5: Trial balance not validated through the month
The fifth close failure is the absence of a through-the-month trial-balance validation. The trial balance (the listing of all GL accounts with their debit and credit balances, which by accounting law must be in agreement at all times) should be in balance after every posting cycle, but if the night-audit-to-GL pipeline has any mapping errors or out-of-balance journal entries, the trial balance will silently drift out of agreement and the controller will not see it until the close routine runs.
The fix is to enforce a daily trial-balance check as part of the night-audit close, with the night audit failing (requiring a controller intervention) if the trial balance is out of agreement. Most modern accounting tools support the check natively, and most properties have it turned off because the original setup did not include it. Enabling it takes 5 minutes. The corresponding fix is to investigate any failure within 24 hours of detection rather than at month-end, which keeps the controller in the operational context where the failure happened and lets her resolve it in 15 minutes rather than 2 hours.
Close failure 6: Departmental managers not engaged in close
The sixth close failure is that the controller runs the close in isolation from the F&B manager, the spa director, and the executive housekeeper. The departmental P&L is supposed to reflect the operational reality of each department, and the department head is the only person who can validate whether the cost-of-sales figures, the staffing costs, and the supply expenses make sense for the period. The right close engages each department head in a 30-minute review of their P&L before the financial statements are finalized.
The failure is that most properties produce the financial statements first and ask department heads to comment afterward, which means errors that the department head would have caught (a misposted F&B inventory adjustment, a spa product expense that landed in the wrong cluster, a housekeeping supply purchase posted to the wrong account) survive the close and surface only when the GM presents the statements at the monthly review meeting. The fix is to schedule a 30-minute departmental P&L review with each department head 24 to 48 hours before the financial statements are finalized, walk through the period's revenue, COGS, and expense lines, and capture any corrections. The work shifts the error-detection from post-statement (where corrections are awkward and produce restatement of the period) to pre-statement (where corrections are routine).
Close failure 7: Month-end overtime without process improvement
The seventh close failure is the cultural pattern where month-end is treated as a high-overtime crunch period with no review of the underlying process. The controller works 12-hour days for the first week of the next month, the close gets done, the team breathes a sigh of relief, and the same pattern repeats four weeks later. The crunch produces real burnout but no structural improvement.
The fix is to run a post-close retrospective inside 48 hours of the close, with the controller, the night auditor, and any other staff involved. The retrospective is 30 minutes, and the agenda is what took longer than expected this cycle, which exceptions reappeared from prior cycles, and which one process improvement to commit to for the next cycle. The compounding effect of running the retrospective consistently for 6 cycles is dramatic. Properties that adopted the practice in our sample dropped their median close time from 11 days to 4 days within 6 close cycles, with no other change in tools or staffing. The discipline is the difference.
The chart-of-accounts cleanup most independents need
The chart of accounts at most independent hotels is a hand-me-down. The original chart was built by an external accounting firm at the time the property was set up, the chart got modified over time as new revenue streams (a new resort fee, a new spa service, a new ancillary product) were added, and the chart now reflects the operational reality from years ago more than it reflects the operational reality of 2026. The cleanup is a 1-to-2-week project for an experienced hospitality controller, and the resulting chart pays back its setup cost within the first month-end close that runs against it.
Cleanup 1: Revenue clusters with channel detail
The first cleanup is the revenue cluster restructuring. The 2026 reference structure has six revenue clusters (Rooms 4000-series, F&B 5000-series, Spa 6000-series, Banquets 7000-series, Retail 8000-series, Other 9000-series), each split by source (direct, OTA, GDS, group, corporate) where the split is operationally meaningful. The contra-revenue accounts for commission and processing fees sit in the same cluster as the gross revenue, so the cluster total is the net contribution.
The cleanup work is to map each existing GL account to the new structure, reclassify the historic balances to the new structure (which most accounting tools support as a one-time bulk reclass operation), update the PMS-to-GL bridge to point at the new accounts, and run a parallel report for one period to validate that the new structure produces the same total revenue as the old one (it should, if the reclass was done correctly). The work takes a controller and the external accountant 16 to 24 hours total. The output is a chart that produces departmental P&L and channel-mix reporting directly from the GL with no manual mix analysis.
Cleanup 2: Cost-of-sales with departmental detail
The second cleanup is the cost-of-sales restructuring. The 2026 reference has a parallel cost-of-sales cluster mirroring the revenue cluster, so each revenue line has a corresponding COGS line in the same series number range, and the gross-profit-per-department is computable from the cluster directly. Rooms COGS includes housekeeping supplies, room amenity costs, in-room consumables, and direct rooms labor. F&B COGS includes food cost, beverage cost, kitchen labor, and front-of-house labor. Spa COGS includes treatment products, retail product cost, and treatment labor.
The cleanup work is to identify which existing expense accounts are operationally COGS versus operationally departmental expense versus operationally property-level overhead, reclassify accordingly, and configure the appropriate per-unit allocation rules (per occupied room night for rooms, per cover for F&B, per treatment for spa). The 2025 USALI update has detailed guidance on the right COGS classification for each department, and the right cleanup follows USALI as the canonical reference rather than improvising local definitions. F&B charge posting in 2026 covers the F&B-side mechanics that interact with this COGS structure on the revenue side.
Cleanup 3: Control-account-and-detail-account discipline
The third cleanup is the control-account structure. The 2026 reference defines four primary control accounts (AR Control for the city ledger, AP Control for vendor payables, Folio-in-Progress Control for in-house guest folios, Inventory Control for housekeeping supplies and F&B inventory), each with an enforced equality between the control balance and the sum of the underlying detail. The control structure is what protects against silent drift in the city ledger, the in-house folio, and the inventory balance, all of which can accumulate variance over time without an explicit control discipline.
The cleanup work is to identify the control accounts, document the corresponding detail-account scope (which accounts roll up to which control), enable the daily control-equals-detail check in the accounting tool, and document the post-and-contra discipline so any control-account adjustment requires a corresponding detail-account adjustment. The set-up takes 4 to 6 hours. The ongoing discipline is the daily check, which takes 5 minutes when it passes and 15 to 60 minutes when it fails (which is the operationally appropriate amount of time to investigate a control failure, before it propagates).
Cleanup 4: Deferred revenue and deposit aging
The fourth cleanup is the deferred-revenue structure. The 2026 reference has a single deferred-revenue control account, with a sub-ledger that ages the deferred revenue by stay date and an automated daily release routine that converts earned deposits to revenue night-by-night. The structure protects against the silent build-up of deposits that have technically already been earned, which is one of the most common P&L misstatements at properties running a deposit-on-booking model.
The cleanup work is to migrate the existing deferred-revenue balance from a flat liability account to the aged sub-ledger structure, configure the daily release routine, and reconcile the deferred-revenue balance against the active reservations list weekly to catch any drift between the sub-ledger and the operational truth. Properties that adopt the structure see their deferred-revenue audit comments drop to zero within two cycles, and the corresponding revenue-recognition smoothing produces a more accurate period-to-period P&L.
Cleanup 5: Credit-card fee and channel-cost allocation
The fifth cleanup is the credit-card fee allocation. The 2026 reference has contra-revenue accounts in each revenue cluster for credit-card processing fees, OTA commissions, GDS fees, channel-manager subscription costs, and other channel-specific costs of acquisition. The structure produces a per-channel net contribution number directly from the cluster total, which is the analysis the revenue manager and the GM actually need.
The cleanup work is to map each existing channel-cost expense to the corresponding contra-revenue account in the right cluster, reclassify historic balances, and configure the payment-processor and OTA bridges to post the channel costs to the right account on a per-transaction basis rather than a single monthly journal entry. Prostay Pay ships the per-transaction cost allocation as a default behavior, with each card-present and card-not-present transaction producing a posting that includes the gross revenue and the corresponding fee allocation, which is the operational version of the cleanup that this section describes structurally.

The integration decision: Xero, QuickBooks Online, SAP Business One, Microsoft Dynamics 365 Business Central
The accounting-platform decision for an independent hotel in 2026 is one of the higher-stakes operational choices a property makes, because the platform shapes the chart-of-accounts structure, the reporting capability, the audit-trail compliance, and the multi-entity flexibility for the next 5 to 10 years. The honest 2026 read is that the choice groups into three brackets by property size and legal-entity count. The framing below is the version we recommend to independent operators, calibrated against the actual operational requirements at each property tier rather than the brand marketing.
Bracket 1: 30 to 80 rooms, single entity, Xero or QuickBooks Online
For a single 30-to-80-room independent property with one legal entity, Xero or QuickBooks Online is the right answer almost every time. Both platforms handle the chart-of-accounts structure described above, both have well-supported PMS-to-accounting bridges through modern booking engines, and both produce an audit trail that an external accountant can certify at year-end without friction. Xero is stronger in the UK, Australia, New Zealand, parts of Europe, and emerging markets where it has built localized tax handling. QuickBooks Online is stronger in North America and parts of Latin America. The functional gap between them is small for a hotel of this size, and the right choice is usually the one your external accountant already supports, since the integration with your accountant's practice is more operationally important than the platform comparison.
The pitfall at this size is to over-buy. Properties that select SAP Business One or Microsoft Dynamics 365 Business Central at 60 rooms typically spend 40,000 to 90,000 dollars on implementation, 18 to 30 months on getting the system into stable operation, and end up using 15 to 25 percent of the platform capability. The implementation friction during the rollout obscures the operational data the controller needs to make decisions, which is the opposite of what an accounting platform should do. The right move at 30 to 80 rooms is Xero or QuickBooks Online, with the budget that would have gone to a heavier platform redirected to the chart-of-accounts cleanup, the night-audit-to-GL bridge configuration, and the bank-rec automation, all of which produce more operational value at this property size than the heavier platform would have.
Bracket 2: 100 to 250 rooms, or a 2-to-5-property group, SAP Business One or Microsoft Dynamics 365 Business Central
For a 100-to-250-room property, or for a small group of 2 to 5 properties consolidating to a parent entity, SAP Business One and Microsoft Dynamics 365 Business Central are the realistic options. Both handle the multi-entity consolidation, multi-currency operations, and inter-company eliminations that a group needs as first-class features rather than as workarounds. The functional gap between SAP B1 and Dynamics 365 Business Central at this tier is small, and the right choice usually depends on three factors. First, the existing finance-team skillset, since hiring for SAP B1 expertise versus Dynamics expertise pulls from slightly different talent pools. Second, the parent-company GL standard, if the parent or the investment partner uses one of the two platforms already. Third, the local-implementation-partner ecosystem, since both platforms are typically deployed through implementation partners and the partner quality matters more than the platform choice at this scale.
The pitfall at this size is to under-buy. Properties that try to operate 4 properties on Xero or QuickBooks Online at this scale build a fragile multi-entity workaround that consolidates by spreadsheet, breaks under audit scrutiny, and forces the controller to spend more time on consolidation mechanics than on financial analysis. The right move at 100 to 250 rooms or 2 to 5 properties is to step up to SAP B1 or Dynamics 365 Business Central, accept the 6 to 12 months of implementation friction, and configure the chart-of-accounts and consolidation structure correctly during the implementation rather than retrofitting later.
Bracket 3: 250-plus rooms, or a 5-plus-property group, SAP B1 or Microsoft Dynamics or specialized hotel-accounting overlay
For a 250-plus-room property, a 5-plus-property group, or any property that consolidates with a corporate parent on a different GL, SAP B1 and Microsoft Dynamics are both usable, and the choice depends primarily on the corporate parent standard and the existing finance skillset. At this scale, properties also start to consider specialized hotel-accounting overlays (Inn-Flow, M3, ProfitSword) that sit above the GL and add hospitality-specific reporting, USALI compliance checks, and benchmarking against industry data sets. The overlays do not replace the GL, they sit above it and produce the hospitality-specific reporting that the underlying GL platform does not natively support.
The pitfall at this size is platform sprawl. A 350-room property that runs SAP B1 plus an overlay plus a separate consolidation tool plus a specialty reporting tool ends up with four systems that have to be kept in sync, with the integration debt growing year over year as each platform adds new features that may or may not be supported by the others. The right discipline is to pick one GL platform, one overlay (if needed at this scale), and consolidate the rest of the reporting to those two surfaces, rather than allowing the platform stack to drift wider over time.
The 30-day cleanup playbook
The cleanup playbook below is sequenced for an independent property with a controller, a night auditor, and access to the external accountant for a few hours of consultation. The sequence respects the dependencies between the work blocks, so each week unlocks the next without rework. Properties that ran the playbook in our 27-property sample dropped median month-end close from 11 days to 4 within two close cycles after the playbook completed, and the corresponding operational improvements (cleaner trial balance, faster bank rec, fewer audit comments) compounded over the following year.
Week 1: PMS-to-GL bridge audit and cleanup
Week 1 is the PMS-to-GL bridge audit. The controller, the night auditor, and the external accountant sit down with the full list of PMS transaction codes (typically 80 to 200 codes) and the current GL chart, and walk through every code to verify the mapping. The output is a corrected bridge document that maps each PMS code to the right GL account, with no catch-all bucket and no duplicate mapping. The work also surfaces PMS codes that are configured but unused, which are candidates for retirement.
The day-by-day breakdown for Week 1: Day 1 is the audit prep, where the controller pulls the current bridge, the PMS code list, and the chart of accounts. Day 2 is the audit walk-through, where the team goes through each code in 4-to-6 hours of focused review. Day 3 is the corrections list and the change-control plan, where each mapping change is documented with the before-and-after and the impact on existing reports. Days 4 and 5 are the actual bridge update in the PMS configuration and a parallel-run test where one day of postings is run against both the old and the new bridge to verify the corrections produce the expected GL results. The output of Week 1 is a clean PMS-to-GL bridge that produces a correctly-categorized GL posting every night.
Week 2: Chart-of-accounts restructure
Week 2 is the chart-of-accounts restructure. With the bridge cleaned in Week 1, the chart can now be restructured to the 2026 reference (six revenue clusters with channel detail, parallel cost-of-sales structure, control-account discipline, deferred-revenue aging, contra-revenue accounts for channel costs). The work is mostly in the accounting tool, with the corresponding bridge update in the PMS to map to the restructured accounts.
The day-by-day for Week 2: Day 1 is the design, where the controller and the external accountant draft the new chart against the 2026 reference. Day 2 is the historic-balance reclass plan, where the team identifies which historic balances need to move to the new structure and how the reclass will be executed. Day 3 is the actual chart restructure in the accounting tool, with the new accounts created and the historic reclass executed in a controlled batch. Day 4 is the bridge update to point at the new accounts. Day 5 is the parallel-run validation against one period of historic data, to confirm the new chart produces the same total-revenue and total-expense numbers as the old chart on the same data, with the difference being entirely in the cluster-level breakdown.
Week 3: Soft-close and bank-rec automation
Week 3 is the soft-close discipline and the bank-rec automation. The controller sets up the weekly soft-close routine on her calendar (Monday morning, 60 minutes), documents the soft-close checklist (bank rec status, night-audit exceptions, OTA settlement reconciliation, deferred-revenue release, trial-balance agreement), and runs the soft close for the first time. In parallel, the bank-rec auto-match rules are configured in the accounting tool, with daily matching for cash deposits, weekly matching for card settlements, and exception flagging for any unmatched transaction.
The day-by-day for Week 3: Day 1 is the soft-close setup, where the routine, the checklist, and the calendar block are configured. Day 2 is the first soft-close run, where the controller works through the checklist on the previous week's data and resolves any exceptions found. Day 3 is the bank-rec auto-match configuration, where the rules are set up in the accounting tool. Days 4 and 5 are the first weekly bank-rec runs against the auto-match output, with manual review of the exceptions and tuning of the match rules where needed.
Week 4: Month-end close runbook and audit-trail discipline
Week 4 is the month-end close runbook and the audit-trail discipline. The controller documents the close routine as a sequenced runbook with day-by-day tasks (close day 1 is the bank rec finalization, close day 2 is the OTA reconciliation, close day 3 is the departmental P&L review with each department head, close day 4 is the financial statement preparation, close day 5 is the GM review), and the audit-trail discipline (post-and-contra only, no edits to closed periods, dual authorization for material post-period adjustments) is enabled in the accounting tool.
The day-by-day for Week 4: Day 1 is the runbook draft, where the close routine is documented as a 5-day sequence with explicit responsibilities and deadlines. Day 2 is the audit-trail configuration, where the post-and-contra discipline, the period-lock, and the controller-approval flow are enabled. Day 3 is the dry-run, where the runbook is walked through against the previous month-end's data to test the sequence and identify any gaps. Days 4 and 5 are the runbook refinement based on the dry-run findings, and the controller-and-GM alignment on the close commitments going forward. The first month-end after Week 4 typically still takes 7 to 10 days because the team is still building the muscle memory, and by month two of running the playbook the close drops to 4 to 5 days, and by month three the close is at 3 to 4 days as the soft-close discipline catches the remaining drift through the month.
Decision matrix by property segment
The decision matrix below condenses the recommendations from this article into a property-segment-by-segment view, so an operator reading this can find the row that matches her property type and pull out the priority actions. The matrix is calibrated against the 27-property sample we used throughout this article, complemented by USALI 11th edition reference and the 2025 USALI update guidance.
Segment 1: 30 to 50-room boutique independent, single legal entity
The priority actions for a 30-to-50-room boutique independent in 2026 are, in order, the PMS-to-GL bridge audit (almost always finds 6 to 12 misconfigured mappings), the chart-of-accounts restructure to the 2026 reference, the soft-close discipline, and the bank-rec automation. The accounting platform should be Xero or QuickBooks Online based on regional availability and external-accountant support. The realistic implementation budget is 8,000 to 18,000 dollars in external consulting and 4 to 6 weeks of controller time, with payback inside 3 months from the operational improvements.
The non-priority items at this segment are the SAP B1 or Microsoft Dynamics evaluation (the property is not at the size where the heavier platform pays back), the specialized hotel-accounting overlay (the volume does not justify the overlay cost), and the multi-entity consolidation work (single entity, not relevant). Properties that focus on the priority items first and defer the non-priorities until they are operationally needed see the strongest ROI.
Segment 2: 60 to 100-room urban or resort independent, single legal entity
The priority actions for a 60-to-100-room independent are the same as Segment 1 plus the deferred-revenue aging structure (more relevant at this size because the deposit-on-booking volume is meaningful), the OTA monthly reconciliation discipline (the OTA share is typically 25 to 40 percent of bookings at this size, large enough that monthly reconciliation pays back), and the departmental P&L engagement of department heads in the close routine. The accounting platform remains Xero or QuickBooks Online, with the chart-of-accounts cleanup work taking 6 to 8 weeks. Implementation budget is 12,000 to 25,000 dollars in external consulting plus 6 to 8 weeks of controller time.
Segment 3: 100 to 180-room full-service or 2-property group
The priority actions for a 100-to-180-room property or a 2-property group are the platform evaluation (Xero or QuickBooks Online may still be the right answer for 100 rooms single entity, but a 2-property group typically benefits from SAP B1 or Microsoft Dynamics 365 Business Central), the chart-of-accounts work scaled to the consolidation requirements, the inter-company elimination process for any internal transactions between properties, and the management-reporting layer that aggregates departmental P&L across properties. Implementation budget is 30,000 to 60,000 dollars and 12 to 18 weeks of controller-and-CFO time, with payback inside 6 to 9 months.
Segment 4: 180-plus rooms, or a 3-plus-property group
The priority actions for a 180-plus-room property or a 3-plus-property group are the platform decision (SAP B1 versus Dynamics 365 Business Central, with the choice depending on parent-company GL standard and local implementation-partner availability), the multi-entity chart-of-accounts standardization, the consolidation cycle and the management-reporting layer, and the audit-trail discipline at scale where the post-and-contra workflow has to be enforceable across multiple properties and multiple controllers. Implementation budget is 80,000 to 200,000 dollars and 18 to 30 weeks of CFO-led work, with payback inside 12 to 18 months from the operational and audit improvements.
Where Prostay closes the loop on hotel accounting
Prostay's hotel accounting software exists because the night-audit-to-general-ledger pipeline at most independent hotels in 2026 is structurally broken in 4 to 6 places, and the operational fix is not another reporting layer on top of a busted pipeline, it is a clean pipeline running end-to-end from the folio to the GL. The architecture is built around four operating principles that the rest of this article has implicitly mapped to.
The first principle is native PMS-to-GL bridging. Prostay's booking engine, PMS, point of sale, and payment processor all post directly to the chart of accounts you have configured, with the bridge maintained as a first-class part of the platform rather than a third-party connector that breaks every time the underlying API changes. The bridge audit work that takes 16 to 24 hours of external-consulting time at most properties is replaced by a configuration screen the controller maintains directly. Prostay's property management system and Prostay's point of sale share the same posting layer, so the F&B charge that hits the folio also hits the GL with the same transaction code mapped to the same revenue cluster, no manual reconciliation required.
The second principle is per-transaction cost allocation. Every payment processed through Prostay Pay posts the gross transaction, the processor fee, and any applicable channel cost (OTA commission, GDS fee) as separate but linked GL entries that net to the cluster contribution at the cluster level. The credit-card-fee allocation work that produces a single banking-fee line at most properties is replaced by per-transaction fee posting that maps directly to the contra-revenue account in the right cluster. The departmental P&L is computable from the cluster total directly, with no monthly mix analysis needed.
The third principle is post-and-contra audit-trail discipline at the platform layer. Posted journal entries are immutable. Period locks are enforced. Any correction is a contra-entry with a documented reason and a controller approval. The audit-trail discipline that the 2025 USALI update made an explicit requirement for hotels above 50 rooms or 5 million in annual revenue is built into the platform rather than a configuration the property has to remember to turn on. External auditors verifying the trail at year-end find the documentation already in place, which drops audit fees by 20 to 35 percent at properties that switch to the platform.
The fourth principle is bank-rec and OTA-rec automation. Hotel pre-authorization versus deposits, chargeback handling, and the direct-booking conversion economics covered in the linked articles all flow through the same reconciliation surface, with daily cash matching, weekly card matching, and monthly OTA settlement reconciliation running automatically against the GL postings the night audit produces. The exceptions surface to the controller in the morning rather than at month-end, which is the difference between a 4-day close and an 11-day close.
The integration coverage is built around the platforms most independents already use. Xero and QuickBooks Online are first-class targets for the bridge, with the chart-of-accounts mapping configurable per property. SAP Business One and Microsoft Dynamics 365 Business Central are supported through a documented integration spec. Stripe and Adyen are supported as payment processors. Booking.com, Expedia, and Agoda are supported as OTA channels with virtual-card settlement reconciliation built in. Plaid and direct-bank-feed integrations are supported for bank reconciliation. Avalara is supported for tax compliance. The integration list is not the marketing claim, it is the operational requirement for an independent hotel running a clean accounting flow in 2026.
Monday morning
Klara Dvorakova ran the playbook described in this article over 4 weeks in April and May 2026. The PMS-to-GL bridge audit found 14 misconfigured mappings, including the credit-card processing-fee account that had been splitting fees across three wrong departments for 8 months. The chart-of-accounts restructure produced six revenue clusters with channel detail and parallel cost-of-sales structure, and the historic-balance reclass took the controller and the external accountant 3 days of focused work. The soft-close discipline went on Klara's calendar as a 60-minute Monday-morning block, and after two cycles of running it consistently the controller stopped finding exceptions because the night-audit-to-GL pipeline had stabilized. The bank-rec automation cleared the backlog of unmatched transactions inside a week, and the daily exception flag now produces 1 to 3 items a week that take 5 to 15 minutes each to resolve.
The June month-end close took 5 working days, against the 14-day baseline from the prior year. The July close took 4 days. The August close took 3 days. The 48,000 dollars of variance Klara had been chasing for 11 months collapsed into 14,800 dollars of recoverable items (Booking.com refund failures she could now reissue, OTA commission overcharges she could now dispute inside the window, tip-tax over-remittance she could reclaim with a corrected filing) and 33,200 of legitimate accounting timing differences that disappeared when the new chart structure recognized them correctly. The recoverable amount paid back the consulting cost of the playbook in the first month after completion. The audit comments at the September interim review dropped from 6 to 1, and the external auditor specifically noted the post-and-contra discipline as a positive control change.
The honest version of hotel accounting in 2026 is that the structural fixes are mechanical, the operational discipline is learnable, and the platforms that support the work are mature. The friction is not technical, it is organizational, and it is fixed by sitting down for 4 weeks of focused work with the controller, the night auditor, and the external accountant in the room together. Properties that do this once stop running 14-day month-ends. Properties that do not are still chasing the same variances they were chasing the year before. The choice, as Klara put it, is between paying the cleanup cost once or paying the slow-close cost every month for the rest of the property's life. Request a Prostay demo if you want to see what the night-audit-to-GL pipeline looks like when it runs end-to-end on a single platform with the bridges, the audit trail, and the reconciliation feeds built into the operational flow rather than retrofitted on top of it.