The Numbers That Matter
I want to start with a number that should bother anyone running an independent hotel in 2026: 63.4 percent. That is the share of independent hotel bookings that came through online travel agencies in 2025, per the Cloudbeds 2026 State of Independent Hotels Report, which compiled 90 million bookings across more than 180 countries. In some markets it is closer to 80 percent. The same report found that OTA cancellation rates hit 21.8 percent in 2025, more than double the 10.6 percent rate for direct bookings, which means that even the OTA bookings you do take are twice as likely to evaporate before check-in.
And those OTA bookings are expensive. The headline commission is 15 percent at Booking.com and Expedia, but the OtelCiro Hotel Distribution Costs 2026 Guide built up the real number from contracts and invoices and found that the all-in cost lands at 18 to 30 percent at Booking.com once you add Genius (10 percent) and Visibility Booster (3 to 5 percent), 17 to 23 percent at Expedia once you add Accelerator (2 to 5 percent), and 20 to 25 percent at Hotels.com because loyalty redemption is baked in. Direct is not free either, but a Kalibri Labs distribution-cost build shows the true direct cost lands at 5 to 12 percent all in, covering booking engine licence, website hosting, SEM, payments, and the small slice of staff time that runs the program. Even at the worst end of the direct range and the best end of the OTA range, a shifted booking earns the hotel an additional 6 to 18 cents of every dollar.
So why isn't every hotel running this trade harder? Because their websites do not convert. The Roomstay 2026 Hotel Conversion Benchmarks show an average website conversion rate of 1.5 to 2.5 percent all-traffic, 2.5 to 3.5 percent on desktop, and 0.5 to 1.5 percent on mobile, with top performers at 4 to 5 percent. The bookbetterdirect 2026 benchmark, which leans more on luxury and boutique properties, lands at 2.2 to 3.9 percent average and 5 percent plus for top performers. OTAs convert at 12 to 15 percent on the same query because their visitors arrive with much higher booking intent and their checkout flow is built by hundreds of engineers for one purpose: removing every micro-second of friction between "I want to stay there" and "the payment cleared."
The h2c Global IBE and Metasearch Study separates this into two numbers you should commit to memory. Hotel website all-traffic conversion sits at 0.73 percent average for independents (0.66 to 0.81 percent range) and 1.9 percent average for hotel groups. Booking-engine conversion (visits that actually reach the IBE) sits at 3.28 percent average for independents (2.99 to 3.72 percent range) and 6.8 percent average for groups. Optimized independents reach 4.72 percent booking-engine conversion. That five-times gap between marketing-site CR and booking-engine CR tells you exactly where the leak lives.
And direct guests are worth more, by a lot. SiteMinder analysed 125 million reservations across 44,500 hotels in 2024 and found that hotel websites delivered an average booking value of USD 519 per booking, against USD 320 for OTAs (a 62 percent premium), USD 380 for global distribution systems, and USD 446 for wholesalers. The 2025 update revised the direct number slightly to USD 516 against USD 312 for OTAs. Direct guests book higher-value rooms, stay longer, and add more extras, because the booking flow you control gives them room to do exactly that, and the booking flow Booking.com controls is optimized for one thing: pushing the cheapest possible room into the cart.
Put it all together: in 2026, an independent hotel can move a booking from an OTA channel that pays 18-30 percent commission and produces a USD 320 ABV to a direct channel that pays 5-12 percent and produces a USD 516 ABV. The margin uplift per shifted booking is somewhere between USD 120 and USD 220 of pure contribution. The reason most hotels are not shifting more bookings is that the hotel's own website converts at less than half the rate of the OTA they are trying to compete with. This article is the honest 2026 playbook for closing that gap.
The Post-DMA Window Is Open
The reason 2026 is the year to take this seriously is that the legal and structural ground has shifted under the OTA model for the first time since 2010, and most hotels have not adjusted their playbook to reflect it.
On 19 September 2024, the Court of Justice of the European Union ruled in Case C-264/23 that both wide and narrow rate parity clauses must be assessed under Article 101 TFEU and cannot be presumed pro-competitive. On 2 December 2024, under DMA Article 5(3), Booking.com waived all wide and narrow parity clauses for EEA inventory, removing the contractual obligation that for more than a decade had stopped hotels from showing a lower direct rate. On 16 December 2025, the Landgericht Berlin II held Booking.com liable to compensate 1,099 German hotels for damages from unlawful parity clauses used since 1 January 2013. The legal scaffolding that locked direct rates to OTA rates is in active demolition.
For the first time in a decade, an EEA hotel can publish a lower price on its own website than on Booking.com without breaching contract. Outside the EEA the picture is messier, but the precedent matters everywhere: Booking.com cannot afford to enforce parity aggressively in markets where the legal status is uncertain, and most major OTAs are pre-emptively relaxing parity enforcement to avoid sequelae.
What hotels have actually done with this freedom so far is depressingly little. Per the 123compare.me H1 2025 Hotel Pricing Report, independent hotels showed a 37 percent loss rate (direct rate higher than at least one OTA) and only a 54 percent beat rate (direct lowest). The independents who succeed at conversion run beat rates of 60 to 70 percent. Most hotels are still pricing as if December 2024 never happened, which is both a CRO problem and a symptom of how slowly the industry has metabolized the legal change.
The window is not infinite. Booking.com has been investing aggressively in counter-moves: Genius pricing now shows 10 to 15 percent discounts to logged-in members on the displayed rate, which Google interprets as a parity violation against your direct rate; the Visibility Booster program lets hotels buy back their own organic rank for an extra 3 to 5 percent commission; and the company filed an appeal against the German LG Berlin II damages judgment that may slow enforcement of similar claims. The hotels that build a real direct-booking program in 2026 will lock in 4 to 8 percentage points of direct-channel share while OTAs are still reconfiguring their response. The hotels that wait until 2027 will face a Booking.com that has neutralized most of the structural advantage through member pricing and search bidding. Move now.
Stop Optimizing for the Wrong Metric
Before any of the experiments below will actually move the needle, the team has to agree on what we are trying to move. Most hotels track blended conversion rate (total website bookings divided by total website sessions), and use it to evaluate everything from page-speed changes to email campaigns to a redesign of the room cards. Blended CR is the wrong metric for almost every decision you will make in 2026, and the reason is straightforward: it includes branded traffic and remarketing traffic that was already going to book regardless of what you did to the funnel.
A typical independent hotel website session mix looks roughly like this. 20 to 30 percent of sessions are branded organic and direct (someone searching the hotel's name or typing the URL because they already decided), converting at 8 to 18 percent. 10 to 15 percent are remarketing sessions, converting at 4 to 8 percent. 15 to 25 percent are metasearch arrivals from Google Hotel Ads, Trivago, Tripadvisor, and Kayak, converting at 3 to 5 percent on the booking-engine entry. The remaining 30 to 50 percent is paid search, organic non-branded, social, and referral traffic, converting at 0.4 to 1.5 percent if you are lucky.
Move 1 percent of paid-search traffic from 0.8 percent conversion to 1.2 percent conversion and you have done a 50 percent lift on the segment that actually matters, but the blended CR moves from 2.1 percent to 2.3 percent and the change looks unremarkable on the dashboard. Worse: a CRO experiment that adds 2 percent to branded conversion but drops paid-search conversion by 5 percent will register as a net win in blended CR while quietly destroying your acquisition economics. The blended number is too coarse to drive real decisions.
Two metrics you should actually track. First, segmented conversion rate by traffic source, broken at minimum into branded, paid-search non-brand, organic non-brand, metasearch, remarketing, social, and referral. A real CRO program will see different segments respond differently to the same change, and the segmentation is what tells you when an experiment is winning on the wrong cohort.
Second, the real KPI a hotel cares about: direct-channel share of total room nights, measured monthly against the baseline from before any changes shipped. This is the number that ties CRO work to the actual business outcome (more margin on every shifted booking, fewer cancellations, more guest data, longer LTV). A genuine direct-uplift program moves direct share by 1 to 2 percentage points per quarter. Anything less is either cannibalizing branded traffic that was going to book anyway, or shifting bookings between OTA channels rather than away from OTAs altogether.
Hooray Agency's 2026 Hotel Digital Marketing Strategy framing is useful here. Tier 1 KPIs are direct booking rate (target 35 to 50 percent of total), cost per booking, and RevPAR. Tier 2 KPIs are site conversion rate, mobile abandonment, and share of voice on key queries. You optimize the Tier 2 metrics to move the Tier 1 metrics. If a Tier 2 win does not produce a Tier 1 movement within 90 days, it was theatre.
The Five Conversion Killers Hiding in Your Funnel
I have run pre-CRO audits on enough independent hotels in 2024 and 2025 to claim a pattern. Five problems show up in almost every audit, in roughly this order of impact, and the cumulative effect explains most of the gap between the 1.5 percent average and the 4 percent achievable. They are listed below in priority order because fixing them in this order is the difference between a CRO program that returns three to one in 12 weeks and one that quietly drains another year of agency retainer.
1. The 6.3-second page that empties the funnel before room cards load
The OtelCiro 2026 Hotel Website Speed benchmark, drawn from 1,200 hotel websites across the EU and North America, found the average hotel page load time at 6.3 seconds against Google's 2.5-second "Good" LCP threshold. Google's own data, cited in PageSpeed Insights and in the 2019 Deloitte/Google travel-conversion study that everyone keeps citing because nobody has replicated it on a bigger sample, established three numbers worth tattooing on the booking-engine vendor's forehead. First: a 0.1-second improvement in mobile speed drove a 10.1 percent increase in travel booking rates and a 2.2 percent increase in checkout completion. Second: 53 percent of mobile users abandon a page that takes longer than 3 seconds to load. Third: bounce probability rises 32 percent as load time goes from 1 to 3 seconds, and 90 percent as it goes from 1 to 5 seconds.
The Core Web Vitals thresholds for the 75th percentile of real-user visits, per Google Search Central as of 2026 with INP having replaced FID in March 2024, are: LCP under 2.5 seconds, INP under 200 milliseconds, and CLS under 0.1. Only 48 percent of all websites pass all three on mobile per the atlasperk 2025 travel-CRO benchmark, and travel sites pass at a notably lower rate because they carry heavier image galleries, multiple third-party scripts (booking engine, chat widget, review badge, GTM, four pixels, AI summary box), and currency switchers that block render. If your booking-engine vendor cannot tell you your LCP at the 75th percentile from the Chrome User Experience Report (CrUX) or from real-user monitoring on the booking-engine pages, that is the first conversation to have.
2. The iframe booking engine that breaks the brand
The second killer is more political than technical and is the reason I lead with it: the booking engine usually lives in an iframe served from a different domain by a third-party vendor, often with a visibly different visual style from the marketing site, sometimes with a different favicon, occasionally with a different language stack and currency stack from what the user just navigated through. The user clicks "Book Now," the URL changes from yourhotel.com to book.vendor-system.com, the design changes, the load spinner appears, and you have just told the user that the trustworthy brand they were considering booking with has handed them off to someone else.
SiteMinder's Changing Traveller 2025 report found that 52 percent of travellers abandoned an online booking due to a bad digital experience, up 3 percentage points from 2024. The single most common reason cited is that the booking flow feels like it belongs to a different company from the website the guest just researched, and the second is that the design quality of the booking step is visibly lower than the design quality of the room page that preceded it. Iframe IBEs that hard-redirect to a third-party domain produce both effects simultaneously. The minimum bar to fix this is a tokenized iframe IBE that inherits your marketing site's CSS, fonts, and brand colours, hosted at a subdomain (e.g. book.yourhotel.com) with a valid TLS certificate showing the same company name as your main domain. Better is a fully hosted IBE component that runs in the same domain and shares the same React or vanilla JS environment as the rest of the site. The CR difference between "hard-redirect to vendor domain" and "inherited iframe at subdomain" in the Foundry CRO 2026 hotel benchmark is 1.4 to 2.1 percentage points, which on a 2 percent baseline is a 70 to 100 percent uplift.
3. The parity gap that triggers Google's amber-warning death spiral
When your direct rate is higher than the OTA rate for the same night, Google Hotel Ads and the other metasearch platforms display your hotel with an amber price-warning badge that says something close to "higher than other sites." The user clicks it less often. When they do click, they click expecting parity, see your direct rate is worse, and bounce back to the OTA. The Foundry CRO benchmark records a 4 to 7 percent drop in click-through rate and an additional 9 to 14 percent drop in post-click conversion when the amber badge is present compared to a parity-clean listing. The compounding effect is brutal: a parity-broken listing earns roughly half the bookings of a parity-clean listing for the same impression volume.
This is not a CRO problem, it is an operations problem disguised as a CRO problem. The repairs sit in revenue management and channel-manager hygiene, but the bookings impact is felt on the website. Audit weekly. Watch for the four common failure modes: wholesaler leakage (a wholesaler reselling your inventory below your direct rate on a tertiary OTA), Genius pricing disparity (logged-in Booking.com members seeing a 10 to 15 percent discount that Google reads as parity violation against you), promotional windows on OTA rates that the channel manager did not propagate to direct, and package-rate disparities where an OTA bundle appears cheaper than your direct rate even though the OTA package includes a different inclusion set. The post-DMA window only matters if you actually exploit it, and you cannot exploit it until your direct rate is reliably the lowest for the same night.
4. The Member Rate, Free WiFi trust failure
This one is subtle and the easiest to dismiss as cosmetic, which is why almost every hotel still gets it wrong. The hotel's room-and-rate page typically lists a stack of vague benefits ("Member Rate", "Free WiFi", "Free Parking", "Best Available Rate Guarantee") that read as boilerplate. Free WiFi is table stakes in every developed market. Free parking is meaningful only at specific properties. Best Available Rate Guarantee is a sentence the guest has read on twelve other websites in the previous fifteen minutes and they have stopped registering it. The Member Rate cell is hollow: it asks for a sign-up before showing the price, which the guest declines because they came to book a room, not to join a programme.
What works in 2026, measured: specific trust signals tied to the booking they are about to make. Examples that have moved CR by 0.4 to 1.1 percentage points in the Foundry CRO benchmark: a real reservations-team headshot and first name attached to a "Questions? Message Mira" widget that responds in under three minutes during business hours; a price-comparison panel showing the live rate on Booking.com, Expedia, and Hotels.com next to the direct rate, with the parity-cleanest direct rate winning visibly (this requires you to have actually fixed killer 3 first); a real cancellation policy presented as an actual paragraph instead of a tooltip ("Free cancellation until 18:00 local time on 12 June; after that, one night non-refundable; full charge for no-shows"); a single, specific benefit per rate plan ("Member rate: 8 percent off and free upgrade if available at check-in" rather than "Member rate, more benefits"); a small payment-security badge with the actual processor name (Stripe, Adyen, Worldpay, Braintree) that the guest will see on their card statement.
5. The 8-step checkout in a one-handed mobile world
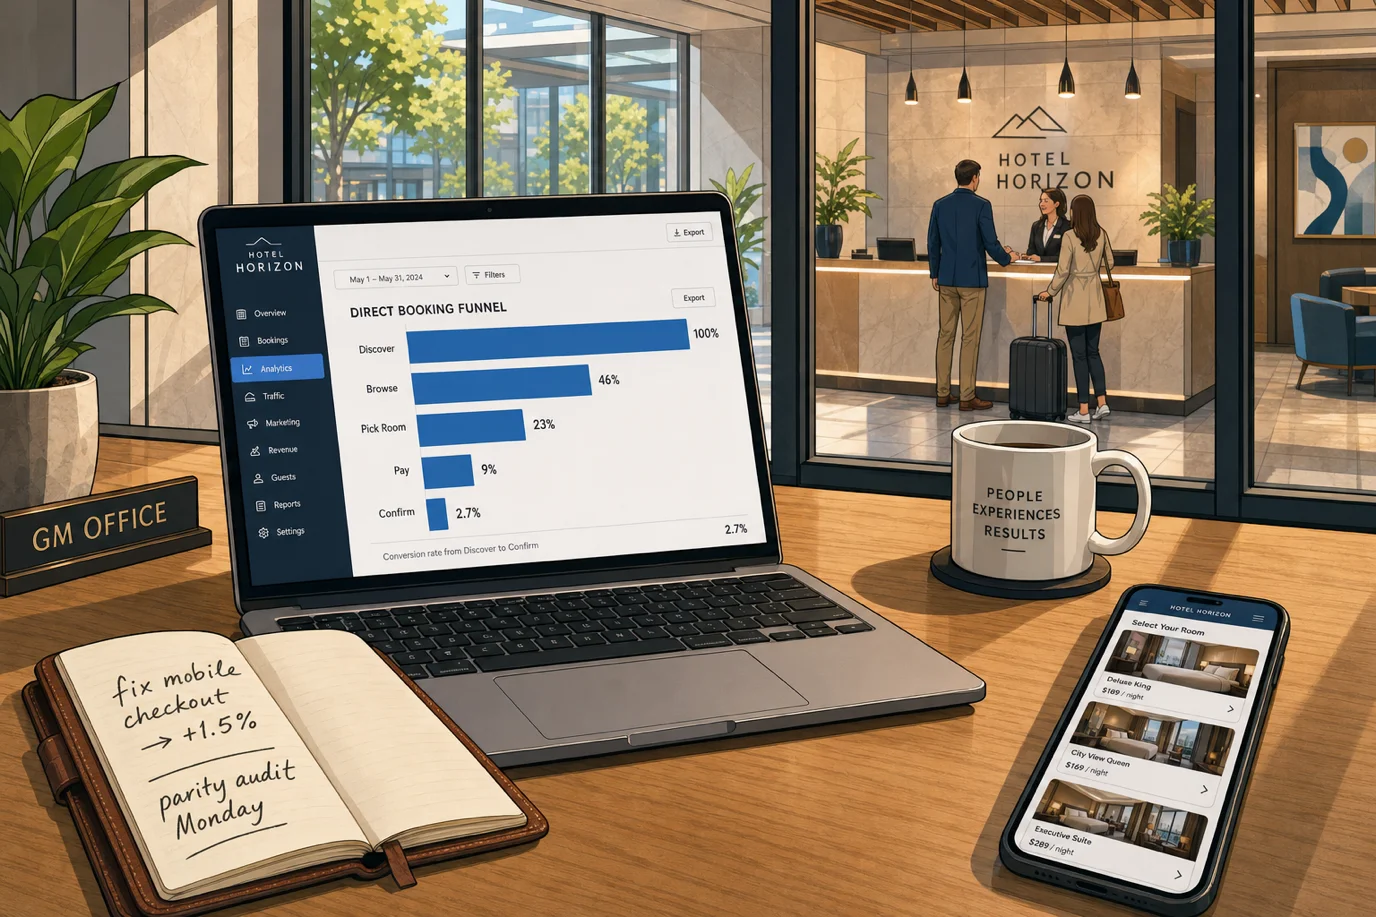
The last common killer is checkout-step inflation. The average hotel booking flow in 2025, per the OtelCiro funnel audit, requires 7 to 9 distinct steps from room selection to payment confirmation: select dates and guests, select room type, select rate plan, enter guest details, enter address, enter card details, agree to terms, optional upsells, confirm. The OTA equivalent on Booking.com mobile is three taps after the room card: room, sign-in (often Apple ID / Google), pay. The user is one-handed on the train. Every additional tap costs.
Baymard's 2024 Checkout Study, the closest thing to authoritative checkout-research the industry has, found that 22 percent of shoppers abandon when forced to create an account, and 24 percent abandon when forced through a multi-step checkout that does not look fast on mobile. Revinate's hotel cart-abandonment compilation puts the all-traffic hotel checkout abandonment rate at 80 to 84 percent, with mobile at 85 percent against desktop at 73 percent. The OTA equivalent abandonment is even higher in absolute terms (89 percent on Booking.com), but Booking.com's funnel is so much wider that the absolute number of completed bookings is far larger.
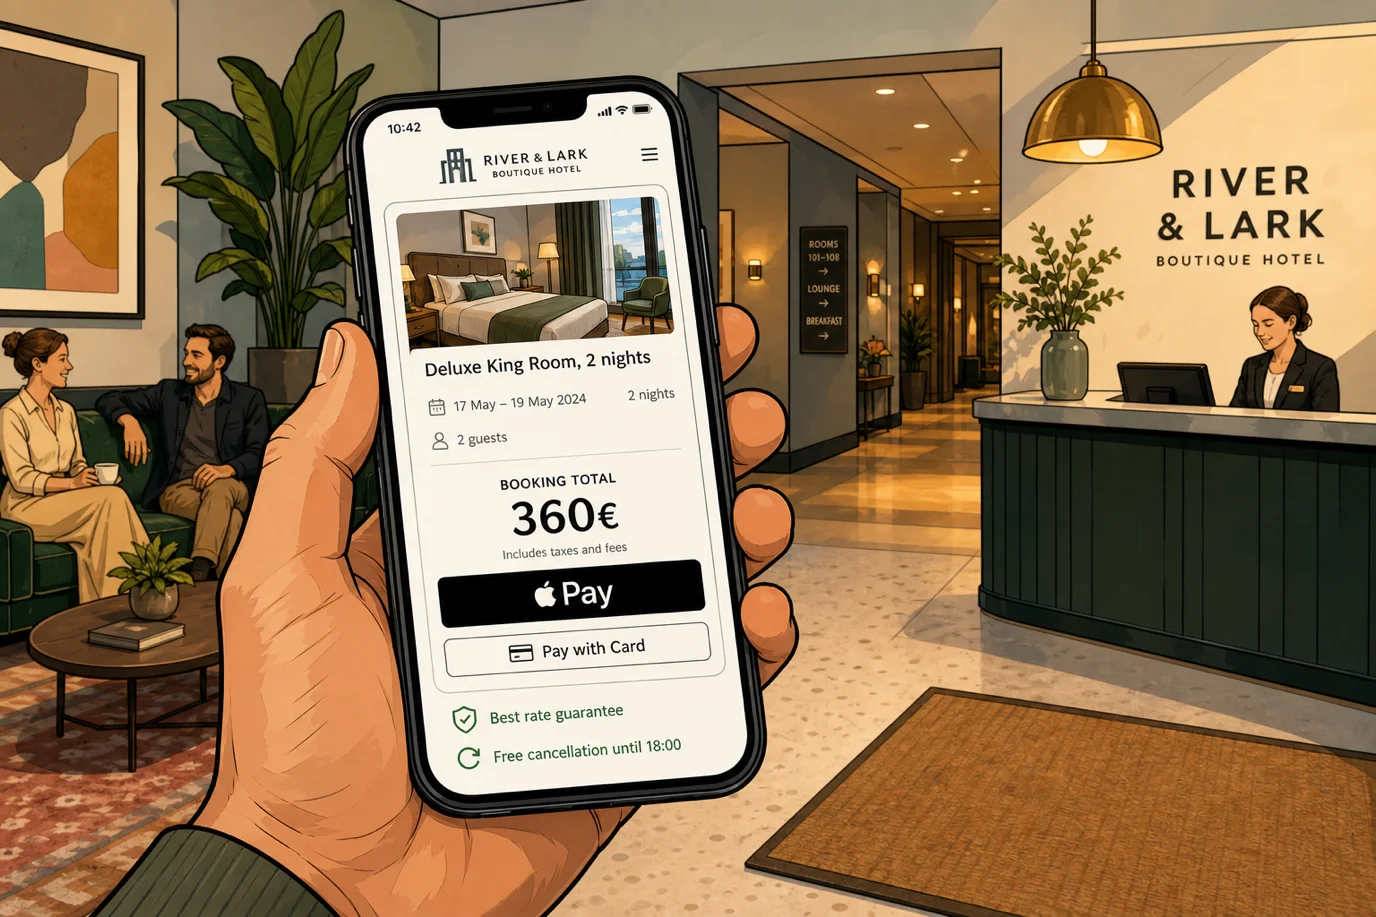
The minimum bar to fix this in 2026 is: collapse room-and-rate selection into one screen (described in experiment 2 below); accept Apple Pay and Google Pay as default payment methods on iOS and Android respectively (described in experiment 3); make account creation strictly optional and post-confirmation, never pre-confirmation; show a sticky progress indicator that names the remaining step rather than a generic 1/2/3 dots; preserve form state on browser back and on accidental navigation. The CR uplift from these five together in the Foundry benchmark is consistently 0.8 to 1.6 percentage points on mobile, which is roughly a 60 to 130 percent improvement on a 1.2 percent mobile baseline.
The Six Experiments That Actually Move the Needle
If the five killers are the diagnosis, these six are the prescription. Each one has a measured lift range in either the Foundry CRO 2026 benchmark, the SiteMinder 125-million-reservation dataset, or both. Each can be implemented in 1 to 3 weeks by a single competent vendor or in-house engineer. The six together, in the order presented, are the 90-day arc that turns a 1.8 percent all-traffic CR into a 3.5 to 4 percent CR for most independent hotels.
Experiment 1: Drive LCP under 2.0 seconds on mobile
Target: 75th-percentile real-user LCP under 2.0 seconds on the homepage, the room-list page, and the rate-selection page. Measured on mobile through the Chrome User Experience Report (CrUX) or any real-user monitoring tool that surfaces the 75th percentile rather than a synthetic median.
The work: convert hero images to AVIF (smaller than WebP at equivalent quality for photographic content) and serve responsive sizes per breakpoint with the fetchpriority="high" attribute on the LCP image; defer or async-load every third-party script that is not strictly required for first paint (chat widgets, review badges, GTM containers, analytics pixels, currency widgets, the AI summary box that nobody clicks); enable HTTP/3 on the origin or behind a CDN; preconnect to the booking-engine domain from the marketing site; remove any client-side currency-conversion JavaScript that holds up first paint and replace it with a static IP-geolocated cookie that persists the user's currency preference.
Expected lift: the 2019 Deloitte/Google study established that every 0.1-second mobile-speed improvement lifts travel bookings by 10.1 percent, and the 2024 Booking.com internal data referenced in Hotelsseo's Page Speed and Hotel Booking Conversions 2025 guide confirms the directional impact. A mid-tier independent moving from an LCP of 5.0 seconds to 2.0 seconds typically sees a 6 to 14 percent CR uplift on the segment of mobile traffic that actually waits for the page, plus a further 2 to 4 percent improvement in organic ranking as Google's page-experience signal kicks in over 4 to 8 weeks.
Experiment 2: Collapse room-and-rate selection into one screen
Target: reduce the average number of mobile screens from room-list to payment from 7 to 9 down to 4. The single biggest gain comes from merging the room-type selection screen and the rate-plan selection screen, which are almost always two separate steps on a hotel website and a single combined step on Booking.com.
The work: redesign the room-list page so each room card expands inline to show the available rate plans (with cancellation policy, inclusions, price-per-night, total price) without navigating to a new screen. The user picks the room and the rate plan from the same screen in a single tap, then moves directly to a one-screen guest-details-and-payment form. This is a 2 to 4 week front-end project on most modern booking engines and a 6-week project on legacy IBE platforms. If your booking engine cannot support inline rate expansion, that is a procurement-grade conversation with the vendor.
Expected lift: the Foundry CRO 2026 benchmark records a 0.6 to 1.3 percentage point lift on the booking-engine CR from the inline-rate-expansion pattern, which translates to roughly 25 to 60 percent more bookings on the segment that reaches the IBE. The lift is larger on mobile (where each additional tap costs more) and smaller on desktop, but it never reverses.
Experiment 3: Tokenized one-tap payment with Apple Pay and Google Pay
Target: 30 to 50 percent of mobile bookings completed via Apple Pay (iOS) or Google Pay (Android) rather than manual card entry. The lower bound is the typical adoption rate at a freshly-launched implementation; the upper bound is what well-designed flows in the US, UK, and Northern Europe achieve after 6 to 12 months of optimization.
The work: configure your payment processor (Stripe, Adyen, Braintree, Worldpay, Mews Payments) to expose the Apple Pay and Google Pay buttons natively at the top of the payment-method selector, above the card-entry form. The buttons need to be the dominant call-to-action on the payment step, not a small "other payment methods" collapsed accordion item. Apple Pay also needs domain verification on the booking-engine domain, which is a 30-minute one-time setup. Card-tokenization vault behaviour should remember the guest's payment method for repeat visits without storing the card on your server (PCI SAQ A scope).
Expected lift: SiteMinder's Hotel Booking Trends 2024 reported that hotels using tokenized payment methods see a 6 to 11 percent uplift in mobile checkout completion, with the larger gains in markets where Apple Pay penetration is highest (Northern Europe, North America, urban Japan). The compounding benefit is that tokenized payments reduce chargeback risk by 30 to 40 percent compared to manual card entry, because the device-level authentication acts as 3DS-equivalent strong customer authentication.
Experiment 4: Member-rate gating with a 7-second sign-up
Target: 25 to 40 percent of qualified non-branded visitors join the member programme on first visit, see a member-only rate that is 6 to 10 percent below the public rate, and book direct on that rate. The member rate is the single most-effective tool the EU post-DMA window has handed to independents: a closed-user-group (CUG) discount that does not violate any remaining parity contracts (because it is not a public rate) and that gives the guest a concrete reason to book direct.
The work: build a single-field sign-up (just an email address) with a one-click confirmation, exposed prominently on the room-list and rate-selection pages as "Join free to see member rates (8 percent off, takes 7 seconds)." The email-only sign-up sets a session cookie that immediately reveals member rates without requiring a verification round-trip. The verification email is sent in the background and matters only for repeat visits. Apple Pay/Google Pay-enabled flows can include a one-tap "Use my Apple ID email" option, which has produced 60 to 70 percent first-visit conversion on member sign-up in the Foundry benchmark.
Expected lift: a measured uplift of 1.0 to 1.8 percentage points on all-traffic CR, almost entirely concentrated in the non-branded segment that benefits most from the price-confidence signal. The secondary benefit is that the email capture starts a CRM list that doubles in value over 18 months as those guests become repeat bookers and word-of-mouth referrers.
Experiment 5: Abandoned-booking recovery emails within 90 minutes
Target: recover 6 to 12 percent of guests who reach the rate-selection or payment step but abandon, by sending a single transactional email with the abandoned cart contents and a one-click resume link within 90 minutes of abandonment.
The work: the booking engine needs to capture email at the start of the rate-selection step (one field, no other guest details required at that point) and trigger a behavioural email at the 90-minute mark if the booking is not completed. The email needs to be a clean transactional template, not a marketing template (no banner, no upsell offers, no "here are our best deals" carousel). It should restate the room, dates, rate, and total in the email body, include the resume link as the primary call to action, and offer the reservations team's direct phone number and email as a secondary path for guests who hit a problem in the original flow.
Expected lift: Revinate's benchmark across 2,200 hotels finds abandoned-cart emails average a 66 percent open rate and 10 percent conversion rate, which on a typical traffic mix produces a 5 to 9 percent net lift on completed bookings. Travel Media Group's larger dataset (3,400 hotels) puts the 48-hour recovery window at 30 to 40 percent of near-completed bookings, with the 90-minute window recovering the lion's share. The cost is a one-time engineering setup of 4 to 12 hours and an email service provider that charges roughly 0.50 to 1.50 euros per recovered booking.
Experiment 6: Parity-aware price-confidence widget on the rate page
Target: a small panel on the rate-selection page that shows the live price on Booking.com, Expedia, and Hotels.com for the same dates and room, alongside the direct rate, with the direct rate visually winning. This is the post-DMA experiment that was contractually impossible before December 2024 and is now permitted in the EEA without legal risk.
The work: subscribe to a rate-shopping service (OTA Insight, RateGain, FastBooking, RoomPriceGenie, the metasearch feed direct from your channel manager) and surface the comparison live on the rate page through their JavaScript widget or through your own backend rate-shop fetch. The widget needs to update in real time (or with a maximum 30-minute cache) so the comparison cannot be wrong. The direct rate needs to actually be the cheapest, which requires that experiment 6 sits on top of a clean parity foundation (killer 3 fixed). Showing the comparison when your direct rate is higher than Booking.com is worse than not showing it.
Expected lift: the Foundry benchmark records a 0.4 to 1.2 percentage point lift on the rate-page-to-payment conversion when the price-comparison widget is present and the direct rate wins. The Hotelchamp 2025 experiment library, drawn from 1,800 independent hotels, found a smaller but consistent 0.3 to 0.7 percentage point lift on all-traffic CR, with the gains concentrated on metasearch-arrival traffic that is explicitly price-shopping.
The Mobile Reality (You Have a Mobile Problem, Not a Website Problem)
The honest read on hotel CRO in 2026 is that almost every "website conversion problem" is actually a mobile problem dressed up as a website problem. The per-device benchmarks make this brutally clear: Roomstay's 2026 benchmark records desktop CR at 2.5 to 3.5 percent against mobile CR at 0.5 to 1.5 percent. Hooray Agency's data shows 65 to 70 percent of hotel website traffic is mobile and 68 percent of mobile bookings are abandoned, against 45 percent on desktop. The mobile CR is roughly a third of desktop CR, and mobile is two thirds of the traffic. That math says mobile is responsible for somewhere between 80 and 90 percent of your lost direct bookings.
The reason mobile underperforms is that hotel sites have been designed by desktop-first product teams, who tend to treat mobile as a responsive afterthought rather than the primary surface. Booking.com has spent more than a decade obsessing about mobile-first design, which is why their mobile checkout is two taps and your hotel's is six. There is no quick fix that closes the desktop-mobile CR gap, but four interventions consistently close half of it within 90 days.
First, redesign the booking-engine flow mobile-first. The room cards, the rate-selection inline expansion, the date picker, the guest counter, the payment form: every interaction needs to be designed for a thumb on a 390-pixel-wide screen first, then progressively enhanced for tablet and desktop. The legacy alternative (a desktop-first design that degrades to mobile through CSS media queries) is what most hotels have, and it is the structural reason mobile is half-converting.
Second, the date picker. Almost every hotel booking flow uses an HTML date picker or a heavy JavaScript calendar widget that takes two taps to advance a month and renders 30 days in a grid that is hard to scan one-handed. The mobile-native pattern in 2026 is a horizontally-scrolling weekly view with the price floored on each date, plus quick presets ("This weekend," "Next weekend," "Next 3 weekdays") that pre-fill the most common selections. The Foundry benchmark records a 4 to 8 percent lift on mobile date-selection completion from this pattern alone.
Third, payment. Apple Pay and Google Pay (experiment 3 above) is the single highest-impact mobile intervention. The 30 to 50 percent of mobile bookings that complete via tokenized payment effectively skip the manual card-entry form, which is where most mobile abandonment concentrates. Adding the two payment methods to a previously card-only checkout typically lifts mobile CR by 0.4 to 0.8 percentage points, which on a 1.2 percent baseline is a 30 to 70 percent improvement.
Fourth, performance. Mobile devices are slower, on slower networks, with less RAM available for your JavaScript bundle. A bundle size that is "fine" on desktop is often catastrophic on a four-year-old Android in a basement WiFi cell. The 2.0-second LCP target from experiment 1 above is harder to hit on mobile than on desktop, and the way to hit it is to ship less JavaScript to mobile (route splitting, deferred third-party scripts, lazy-loaded images below the fold). If your booking-engine vendor cannot show you a mobile bundle size under 200 KB compressed for the room-selection page, the bundle is the conversation.
The unsurprising consequence of all this is that a CRO program that focuses exclusively on mobile, ignoring desktop entirely, will generate more lift than a program that splits effort evenly. For most independents in 2026, mobile should get 70 to 80 percent of the engineering attention.
The 14-Day Audit One Person Can Run
Before any of the experiments above is worth the engineering time, run a 14-day audit. The goal is to surface where the leaks actually are on your specific site, in your specific channel mix, with your specific guest profile. The audit takes one operations-literate person, six to eight hours per day across 10 working days, and the only tools required are Google Analytics 4, Google Search Console, PageSpeed Insights, the Chrome DevTools Lighthouse report, the booking-engine vendor's backend reporting, and a rate-shopping tool you can trial for two weeks (OTA Insight, RateGain, RoomPriceGenie all offer free trials).
Days 1 to 3: baseline measurement. Pull the last 90 days of website analytics segmented by traffic source (branded organic, direct, non-branded organic, paid search non-brand, paid search brand, metasearch arrival, remarketing, social, referral, other paid). For each segment, capture sessions, sessions to room-selection page, sessions to rate-selection page, sessions to payment page, completed bookings, ABV, and total booking value. The numbers you actually need from this exercise are: the conversion rate by segment, the funnel drop-off rate from page to page, and the page-load time and bounce rate by page template. If you cannot produce this table for your site in three days, the GA4 implementation is broken and that is itself the first finding.
Days 4 to 6: page-speed and Core Web Vitals diagnosis. Run PageSpeed Insights and Lighthouse on the four highest-traffic page templates: homepage, room-list, rate-selection, payment. Capture LCP, INP, CLS, total blocking time, and the JavaScript bundle size at the 75th percentile of real users (from CrUX if your site has enough traffic to populate the field data, or from real-user monitoring on the booking-engine vendor backend). For each metric that is in the "Needs Improvement" or "Poor" range, document the specific cause (which image, which script, which font file, which third-party tag) and estimate the engineering effort to fix.
Days 7 to 9: parity and competitive rate audit. Use the rate-shopping tool to pull the live rate on Booking.com, Expedia, Hotels.com, Agoda, and your direct booking engine for every day in the next 90 days, for your most-sold room type. Calculate your beat rate (percentage of nights where direct is the lowest rate), your match rate (within 0.5 percent), and your loss rate (direct is higher than at least one OTA). The 123compare.me 2025 benchmark for independents is 54 percent beat / 9 percent match / 37 percent loss. If your numbers look worse than that benchmark, the parity-cleanup work is bigger than the CRO work and must come first.
Days 10 to 12: checkout-flow walkthrough. Book a non-refundable room on your own website from a fresh mobile browser session, in incognito mode, on a real mobile device on cellular (not on WiFi at the office). Record the screen. Count the taps from arrival to confirmation. Capture the cumulative time. Note every place where the design changes, the load spinner appears for longer than 1 second, an upsell modal interrupts, an account-creation prompt appears, or a form field requires more than three taps. Repeat for a refundable rate, for a multi-room booking, for a booking with a child added, and for a booking that requires international currency conversion. The five flow recordings together typically surface 12 to 25 issues, of which 4 to 8 are CR-impactful enough to fix in the 6-week plan below.
Days 13 to 14: synthesis and prioritisation. Pull the findings together into a single document listing each issue, the estimated CR impact (use the lift ranges in this article as a guide for sizing), the engineering effort in person-days, the dependencies on the booking-engine vendor or third-party tools, and the prioritisation score (CR impact divided by effort, weighted by whether the issue is mobile-only, all-traffic, or desktop-only). The output is a backlog ranked by ROI per engineering day. The top 8 to 12 items go into the 6-week plan.
The Six-Week Implementation Plan
The plan below assumes you have one in-house operations lead, access to your booking-engine vendor's support team, a frontend developer (in-house or contracted, 20 hours per week for six weeks), and a 6,000 to 18,000 euro budget for booking-engine subscription upgrades, payment-processor changes, rate-shopping tool, email service provider, and incidental engineering. It does not assume an agency on retainer. The agency conversation happens after week 12, when the obvious gains are in and you have data on whether you have hit a ceiling that specialist help would unlock.
Weeks 1-2: Speed, parity, and analytics
Week 1 is performance and parity. Day 1: implement the AVIF hero images with fetchpriority="high", defer all third-party scripts that are not strictly required for first paint, preconnect to the booking-engine domain. Days 2 to 3: switch the chat widget and review badge to lazy-load on scroll or after a 5-second idle, remove the AI summary box if your data shows under 2 percent of users interact with it, audit the GTM container for redundant tags. Days 4 to 5: enable HTTP/3 on the origin, configure brotli compression on the CDN, set up real-user monitoring through CrUX or a vendor tool that surfaces the 75th-percentile LCP/INP/CLS. By end of week 1, the LCP on the homepage and room-list templates should be under 3.0 seconds at the 75th percentile and trending toward 2.0 over the next 30 days as the CrUX data refreshes.
Week 2 is parity and analytics. Days 6 to 8: complete the parity audit from day 7-9 of the 14-day audit, escalate the worst offenders to the channel manager, set up a weekly automated parity check that emails the reservations manager. Days 9 to 10: rebuild the GA4 event schema to capture the funnel steps cleanly (room-list view, rate-selection view, payment-step view, booking confirmation), implement enhanced ecommerce so each step records the price the user saw. By end of week 2, the analytics dashboard shows the funnel by traffic source, mobile vs desktop, and the parity weekly report is in the inbox of someone with authority to fix it.
Weeks 3-4: Funnel and payment
Week 3 is the inline rate-expansion redesign (experiment 2) and the tokenized payment (experiment 3). Days 11 to 13: the booking-engine vendor builds the inline-rate-expansion pattern on the room-list page. If your vendor cannot do it in three days, escalate to product. Days 14 to 15: enable Apple Pay and Google Pay on the payment processor, do the Apple Pay domain verification, redesign the payment-step screen so the two buttons are the dominant CTA above a collapsed card-entry accordion.
Week 4 is mobile date picker and mobile bundle. Days 16 to 18: replace the date picker with a horizontally-scrolling weekly view with quick presets (this weekend, next weekend, next three weekdays) and price-floor by date. Days 19 to 20: route-split the booking-engine JavaScript bundle so the room-list page ships under 200 KB compressed to mobile, deferred-load the upsell modal that previously fired on rate-selection, audit the third-party scripts the vendor ships and request removal of the two or three that are not strictly required. By end of week 4, the mobile CR should be visibly up in the GA4 dashboard, typically by 0.4 to 0.7 percentage points.
Weeks 5-6: Trust, member rate, and recovery
Week 5 is trust signals (killer 4) and the member-rate gating (experiment 4). Days 21 to 23: redesign the room-and-rate page to surface specific cancellation policies as paragraph text, attach a reservations-team headshot and first name to the chat widget, add a small payment-processor badge to the payment step, and replace the generic "Best Available Rate Guarantee" with the specific direct-rate beat that experiment 6 enables. Days 24 to 25: implement the 7-second member-rate sign-up with the email-only form and the immediate session-cookie reveal, set the member rate at 6 to 8 percent below the public rate, configure the email service provider to send the verification email asynchronously.
Week 6 is the abandoned-cart recovery (experiment 5) and the price-confidence widget (experiment 6). Days 26 to 28: configure the booking engine to capture email at the start of rate-selection, set up the 90-minute behavioural trigger on the email service provider, design the clean transactional template with the resume link and the reservations-team contact details. Days 29 to 30: install the rate-shopping widget on the rate-selection page, verify the parity foundation is clean enough to show the comparison, set up a manual rate-spot-check workflow for the first two weeks to catch any case where the widget displays incorrectly. By end of week 6, the all-traffic CR should be up by 0.8 to 1.5 percentage points from the week-1 baseline, the mobile CR should be up by 0.6 to 1.2 percentage points, and the direct-channel share of bookings should be visibly trending upward in the monthly KPI report.
Weeks 7 to 12 are measurement, iteration, and the second wave of experiments based on what the data shows. By week 12, the direct-channel share should have moved 1 to 2 percentage points, the booking-engine conversion should have moved from the 2.5 to 3.0 range into the 3.5 to 4.0 range, and the question of whether to bring in a CRO agency for the next layer of optimization becomes data-driven rather than aspirational.
The KPIs to Track (Tier 1 vs Tier 2)
A clean separation between Tier 1 (commercial outcome) and Tier 2 (CRO mechanism) metrics is the single most useful management discipline a hotel can adopt for the post-DMA period. Tier 1 metrics get reported to the owner, the GM, and the revenue manager monthly. Tier 2 metrics drive the engineering and marketing roadmap weekly. A Tier 2 win is meaningless until it produces a Tier 1 movement.
Tier 1 metrics (the commercial outcome):
- Direct-channel share of total room nights. Target: 35 to 50 percent by end of year one, moving from a typical independent baseline of 20 to 35 percent. Move 1 to 2 percentage points per quarter or the program is not working.
- Net contribution per direct booking minus net contribution per OTA booking. The clearest way to express the actual value the program is generating, calculated as (direct revenue * (1 - direct distribution cost)) minus (OTA revenue * (1 - OTA distribution cost)) per shifted booking. Typically 120 to 220 USD per shifted booking in 2026.
- Total RevPAR. The honest gut-check: if direct share is climbing but RevPAR is flat, you are shifting bookings rather than growing them. Still a margin win, but not the same as a demand win.
- Cost per direct booking acquired. The fully-loaded cost (booking engine licence + SEM + email service provider + share of staff time + share of website maintenance) divided by direct bookings. Target: under 8 percent of direct ABV by end of year one.
Tier 2 metrics (the CRO mechanism):
- All-traffic conversion rate by traffic source. Branded, paid-search non-brand, organic non-brand, metasearch, remarketing, social, referral. Different segments respond to different changes.
- Mobile vs desktop conversion rate. Track them separately. The work needed to lift each is different.
- Booking-engine conversion rate (sessions that reach the IBE that complete payment). Target: 4 percent by end of week 12, 5 percent by end of year one.
- Funnel drop-off rate at each step: room-list view, rate-selection view, payment-step view, payment completion. The shape of the drop-off tells you which experiment to ship next.
- Page-load time and Core Web Vitals at the 75th percentile on the four highest-traffic templates. Treated as a permanent quality gate, not a one-off project.
- Parity beat rate, weekly. Below 60 percent is the work that has to happen before any CRO experiment ships meaningful lift.
- Cancellation rate by channel. The Cloudbeds 21.8 percent OTA vs 10.6 percent direct gap is roughly the magnitude you should see; if your OTA cancellation rate is lower than 18 percent or your direct is higher than 13 percent, dig into why.
The honest sequence is Tier 2 work feeds Tier 1 outcomes feeds Tier 2 prioritisation. Anything else is theatre.
Where Prostay Fits, Briefly and Honestly
I write for Prostay so this section is unavoidable, but I will keep it short and direct. Prostay is a property management system and booking engine for independent hotels. From the CRO perspective discussed in this article, the relevant capabilities are: an in-domain booking engine that runs on a subdomain (e.g. book.yourhotel.com) and inherits your marketing site's CSS, fonts, and brand colours rather than redirecting to a vendor domain; native Apple Pay and Google Pay support through Prostay Pay; an inline rate-expansion layout on the room-list page that collapses room-and-rate selection into a single screen; member-rate gating with a 7-second email-only sign-up and immediate session-cookie reveal; abandoned-cart capture at the rate-selection step with configurable behavioural-trigger emails; and a parity-aware rate-comparison widget that pulls live Booking.com / Expedia / Hotels.com rates onto the rate-selection page when activated.
None of those features is exclusive to Prostay. SiteMinder, Cloudbeds, Mews, D-EDGE, Profitroom, Bookassist, and several other modern PMS-plus-booking-engine combinations offer comparable feature sets, and any of them will let you execute the 6-week plan in this article. The genuine structural argument for Prostay is the same one I would make for any tightly-integrated single-vendor stack: when your PMS, channel manager, booking engine, and payment processor share one audit boundary and one rate-and-inventory store, the latency between an OTA cancellation and that inventory becoming available on your direct rate page collapses from minutes to seconds, the parity discipline becomes a configuration setting rather than a weekly fight, and the analytics pipeline shows you the end-to-end funnel from a metasearch click through to the actual nightly revenue on the room.
If you want to see how Prostay handles the specific CRO patterns described in this article, the booking engine, channel manager, and Prostay Pay product pages cover the specifics step by step. If you are running the 6-week plan and need help configuring it with the Prostay implementation team, book a demo and we will walk through it without trying to sell you a separate CRO consulting engagement on top.
Frequently Asked Questions
The five questions independent hoteliers most often ask me about direct-booking conversion in 2026, answered with the current numbers and the honest trade-offs rather than the comforting story.