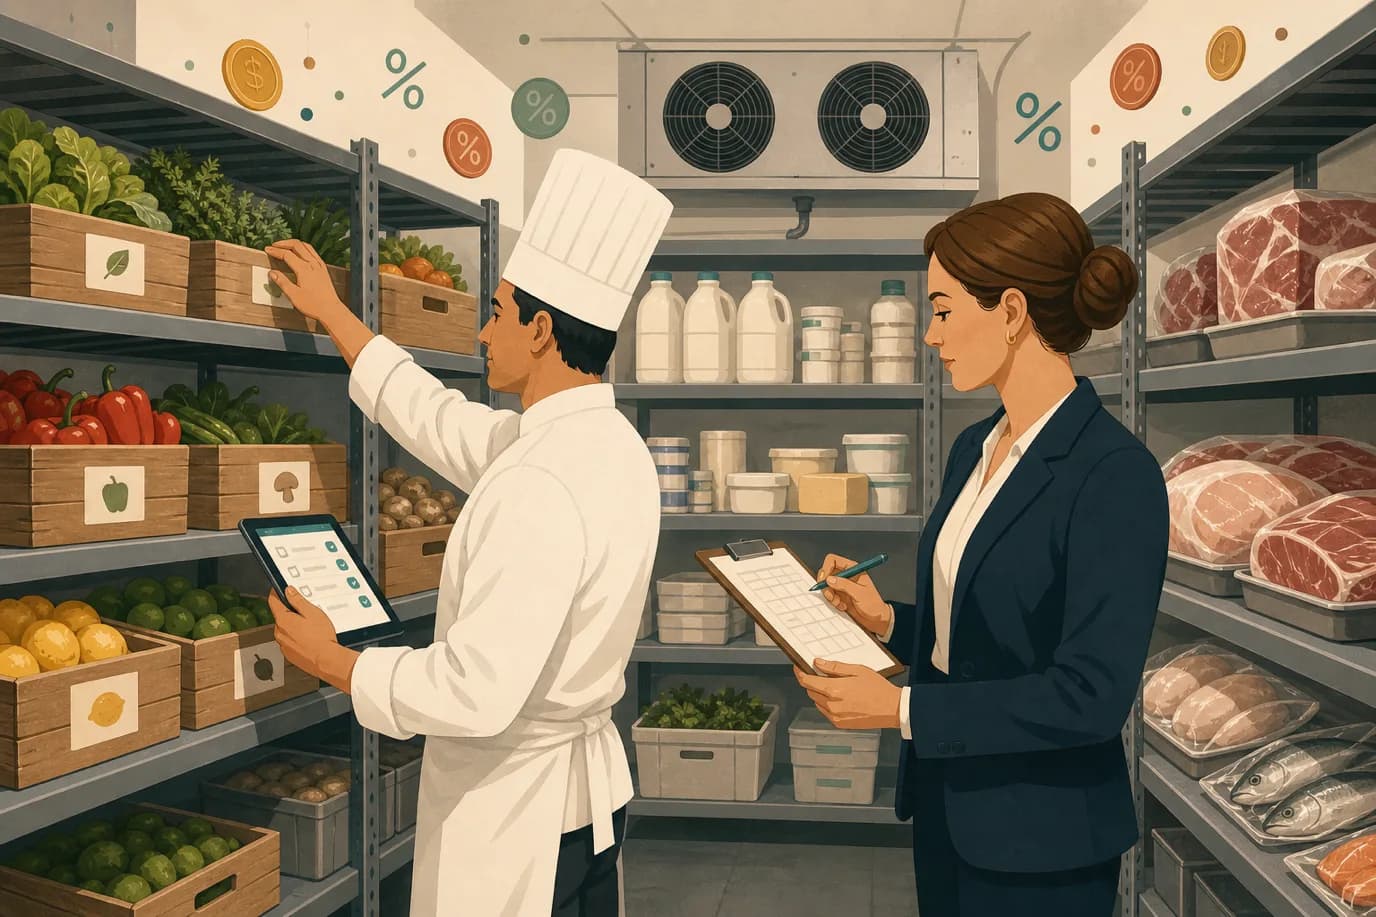
Walk into the storeroom of a struggling restaurant and you can usually diagnose the P&L without seeing it: deep pans of prepped food nobody counted, cases of expensive proteins ordered by habit, a delivery signed for but never checked against the invoice, and a bin that gets heavier every week while nobody weighs it. Food cost is the most controllable number in any restaurant, and inventory is the room where you control it. Not the menu, not the marketing, the shelves.
This guide is the working system: the four numbers that matter and their 2026 benchmarks, par levels built from real usage instead of habit, a weekly counting routine that does not consume a whole night, the variance method that separates waste from theft, and recipe costing that reprices the menu before commodity inflation does it for you. Almost every number in it starts life as a ticket in your point of sale system, which is why the system you choose decides how much of this work is automatic and how much is a spreadsheet. It is written for restaurant operators generally and for hotel food and beverage managers specifically, because a hotel restaurant carries one extra layer, room charges, folios and the ledger, that standalone guides ignore. It belongs to the same commercial discipline as the rest of your food and beverage operation: measured weekly, managed like a product line.
Why Inventory Is the Most Controllable Number in the Building
You cannot move your rent, you can barely move your labor market, and your customers decide your revenue. But the roughly one third of every food sale that walks in through the loading dock is decided by you, every week, in purchasing, portioning, production and counting. That is why the operators who run inventory tightly and the operators who do not can sit in identical locations with identical menus and end the year several margin points apart.
The pressure is not easing. Industry forecasts have food-away-from-home prices rising around 3 to 4 percent through 2026, with some commodities, beef most visibly, climbing far faster. Every point of that inflation lands directly on your plate cost, and the only defences are the unglamorous ones: knowing your usage, buying to par, wasting less, and repricing on facts. Restaurants that still count once a month and calculate food cost once a quarter are managing a 2026 cost base with a 1996 information system.
The good news is that the system is small. Four numbers, one counting habit, one variance review, one costing pass per quarter. None of it needs a consultant; all of it needs consistency.
The Four Numbers That Run the Storeroom
Inventory management produces exactly four numbers a manager needs to see every week. Everything else, the counts, the sheets, the software, exists to make these four honest.
Food Cost Percentage: The Formula and 2026 Benchmarks
Food cost percentage is the share of your food revenue that goes back out the door as ingredients. The formula is simple and the two inventory counts inside it are the whole point:
Food cost % = (beginning inventory + purchases − ending inventory) ÷ food sales × 100
The counts matter because they measure what you used, not what you bought. A month where you stocked up looks expensive on invoices alone; a month where you ran the shelves down looks artificially cheap. The counts correct both distortions.
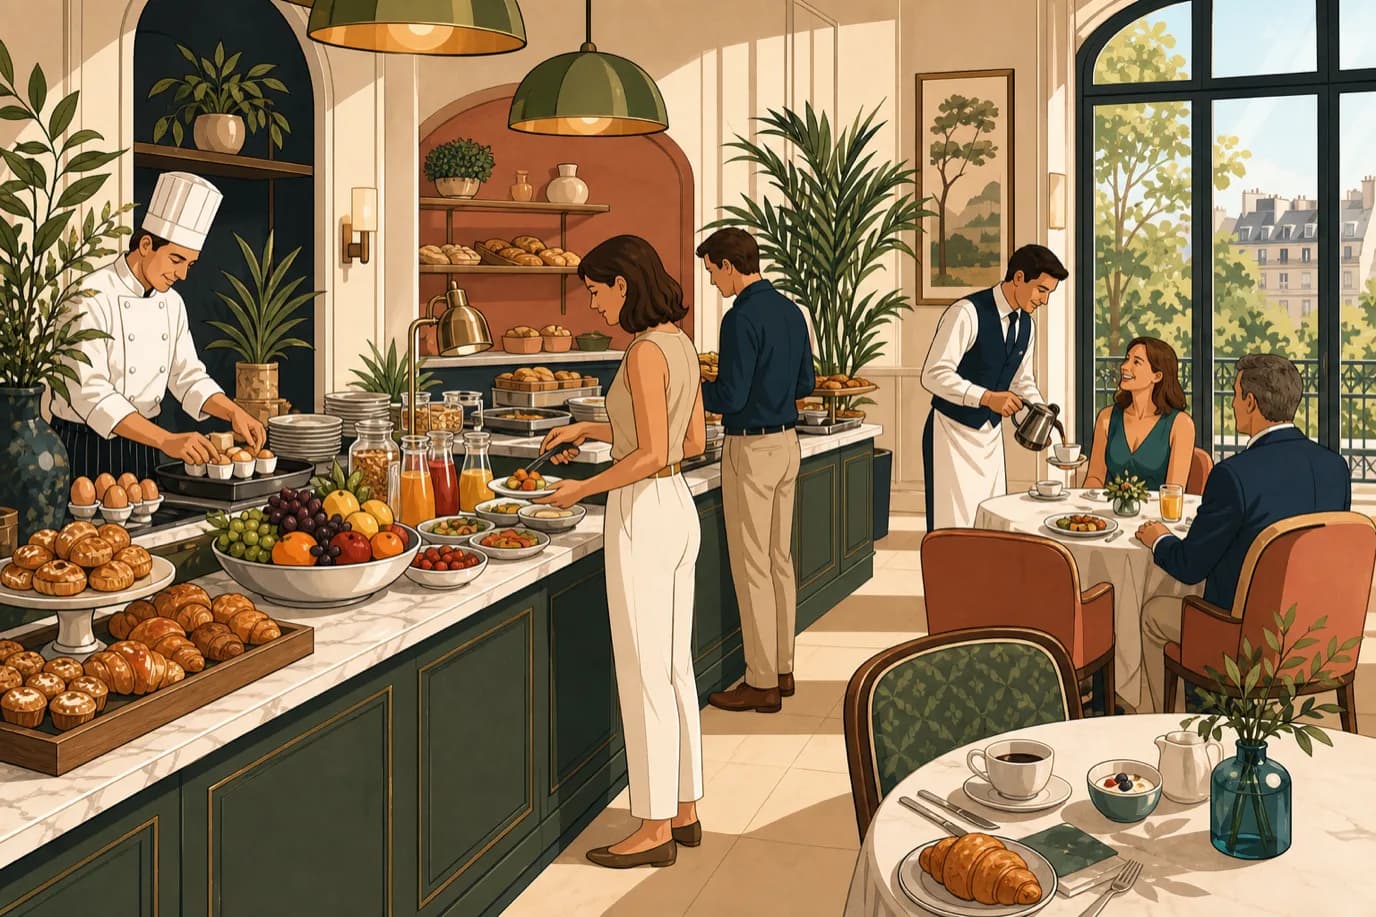
Benchmarks for 2026: most full-service restaurants land between 28 and 35 percent, and operator surveys put the median right around 32 percent. Concept changes everything, quick service runs 20 to 28 percent because volume covers thin plates, casual dining sits at the 28 to 32 industry standard, fine dining runs 30 to 38 because premium ingredients ride on premium prices, and pizza can run as low as 15 to 25, which is why it remains the highest-margin corner of the industry. A hotel breakfast sold as a rate-plan add-on often runs lower still, which is one of the arguments in our hotel breakfast guide for treating it as a product rather than a courtesy.
One warning about the percentage: it is a ratio, and ratios mislead when the denominator moves. A week of banquet business can flatter it; a slow week can slander it. Read food cost percentage as a trend line next to actual gross profit dollars, the same way you read RevPAR next to total revenue among your hotel KPIs.
COGS: Counting What You Used, Not What You Bought
Cost of goods sold is the numerator of the food cost formula, and it is only as accurate as the two counts and the purchase records between them. Three habits keep it honest. Receive against the invoice, not the driver's smile: weigh the proteins, count the cases, and refuse or note the shorts, because a supplier error you signed for becomes your food cost. Post credits and returns in the same period they happen, or one month looks worse and the next looks suspiciously good. And value the count consistently, at the latest invoice price, so that a price rise shows up as a cost increase rather than hiding inside an inflated inventory valuation.
COGS also deserves category resolution. One aggregate number tells you that something is wrong; categories tell you where. Split it at minimum into proteins, produce, dry goods, dairy and beverage, with alcohol always its own line. Beverage cost hiding inside food cost is one of the oldest blind spots in the industry, and the first category split usually surprises whoever orders the orange juice.
Actual vs. Theoretical: The Variance That Finds the Leaks
This is the metric that separates managed inventory from counted inventory. Your point of sale knows exactly what you sold. Your recipes know exactly what each sale should have consumed. Multiply them together and you get theoretical usage: if you sold 100 burgers, 100 patties and 100 buns should be gone. Your counts tell you actual usage: 105 patties and 102 buns are gone. The gap, the variance, is everything that did not turn into revenue: over-portioning, prep waste, spoilage, mistakes, staff meals nobody logged, and theft.
Disciplined operations hold food cost variance under 2 points of sales; anything above that is a project, not a rounding error. The power of the method is that it is item-level: an aggregate food cost of 33 percent is a shrug, but five missing steaks is a conversation you can actually have, with the walk-in, the portion scale, or a specific shift. This is also the strongest practical argument for keeping the point of sale and inventory in one connected system: the theoretical side of the calculation is free when every ticket already decrements a recipe.
Prime Cost: The Ratio That Decides Whether You Are Profitable
Food cost never acts alone; its partner is labor, and together they form prime cost: COGS plus total labor, divided by total sales. The healthy target for most operations is 55 to 60 percent of sales, and anything sustained above 65 means the business is working for its suppliers and its schedule rather than its owners. Prime cost is the number that stops you optimising one line at the expense of the other, cutting prep labor and watching waste rise, or over-prepping to save labor and feeding the bin. The two lines trade against each other, which is why they belong in the same weekly review, alongside the scheduling discipline covered in our staff scheduling guide.
Par Levels That Match How You Actually Sell
A par level is the answer to the only ordering question that matters: how much of this should be on the shelf between deliveries? The formula is average daily usage times days between deliveries, plus a safety buffer of roughly 20 to 30 percent depending on how badly a stockout hurts. Once pars exist, ordering stops being judgement and becomes subtraction: count the shelf, subtract from par, order the difference. A new manager can order correctly in their first week, and the walk-in stops holding a month of capital in two weeks of space.
The craft is in keeping pars alive. Usage is seasonal, menus change, and a par set in January quietly becomes an over-ordering machine by June, the same way an untouched rate plan decays. Recalculate pars quarterly from actual usage data, not from memory; give perishables shorter pars and tighter buffers than dry goods; and let the delivery calendar shape them, because a kitchen with three produce deliveries a week needs a fraction of the produce par of a kitchen with one. Hotels already run this exact discipline elsewhere in the building, linen par management is the same mathematics with pillowcases, and the kitchen deserves the same rigor.
The Counting Discipline: Weekly Counts Without the All-Nighter
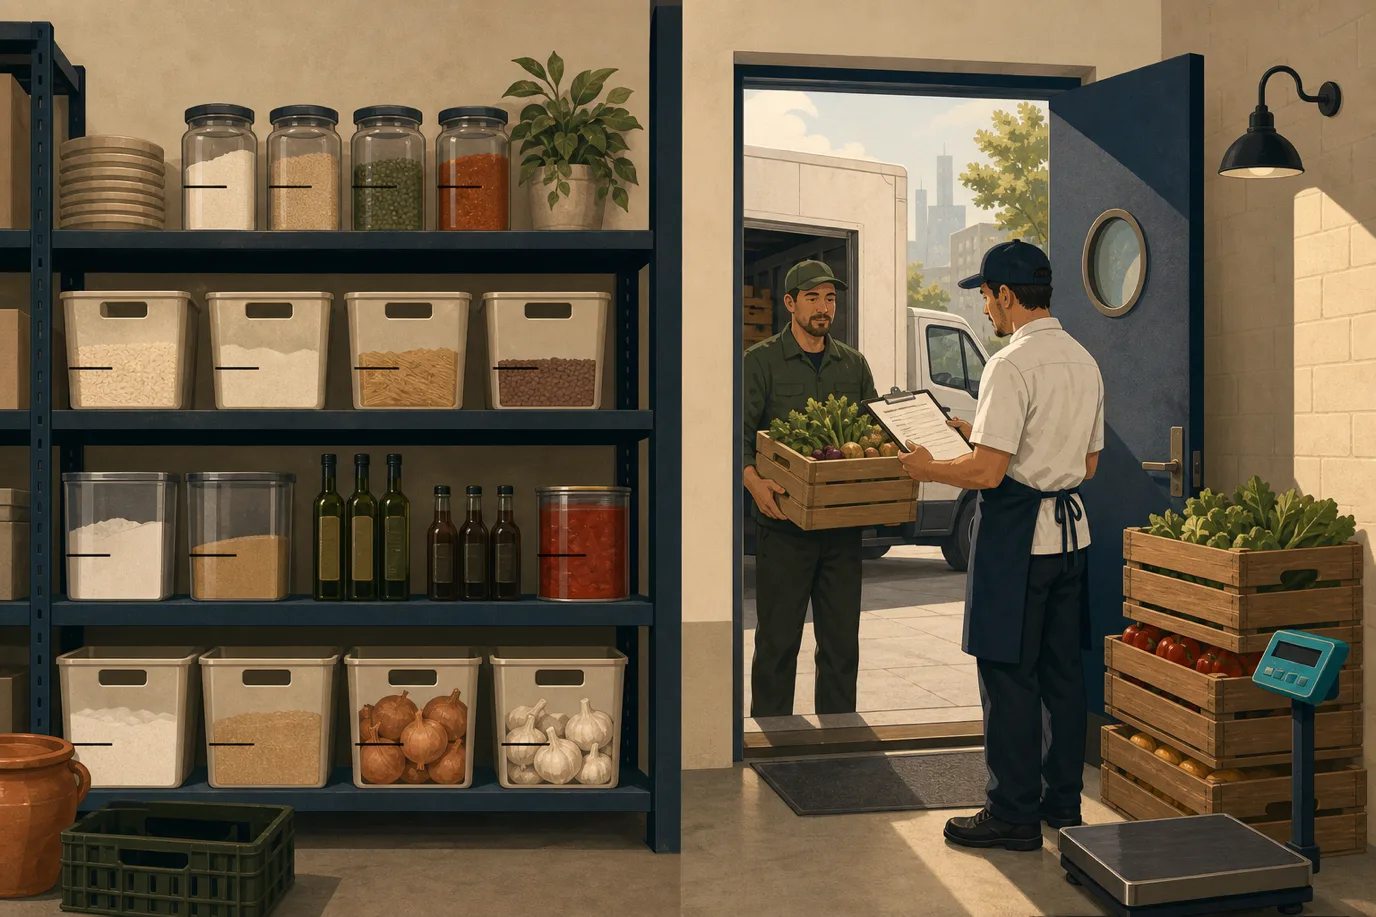
Nobody avoids counting because it is hard; they avoid it because it is badly organised. The full-house count that eats a night once a month is the wrong unit of work. The sustainable rhythm is layered: count the 20 to 30 highest-value items, the proteins, the seafood, the alcohol, every week or even daily, and count the full house monthly for the P&L. In most kitchens the top 20 items carry well over half of total food cost, so a 40-minute weekly count covers the majority of your exposure.
Mechanics that make counts fast and honest: count at the same time on the same day, ideally the morning before your main delivery when shelves are emptiest; organise count sheets shelf-to-sheet, in the physical order items sit in the storeroom, never alphabetically; count in purchase units (cases, kilos) and let the system convert; and use two people where fraud risk matters, one counting, one recording. Freeze the storeroom during the count, receiving a delivery mid-count is how phantom variances are born. And record counts digitally at the shelf, because every hour between a paper count and its spreadsheet is an hour for transcription errors to grow.
Waste, Theft and the Five Missing Steaks
Variance has a short list of causes, and they are worth naming separately because the fixes are different. Overproduction is the biggest in most kitchens: prep cooked to tradition instead of to the forecast. The fix is a production sheet driven by expected covers, in a hotel, driven by tonight's occupancy and tomorrow's booked breakfasts, numbers your property management system already knows. Over-portioning is margin leaving by the ladle: the fix is portion tools, scales at the protein station and a spot-check culture, not speeches. Spoilage is a rotation and par failure: first-in-first-out labelling and honest date checks during the weekly count. Unrecorded consumption, staff meals, tastings, the burnt steak that got remade, needs a waste log by the pass, with a rule the whole kitchen understands: if it is written down it is waste, if it is not written down it is theft.
And theft itself deserves adult treatment rather than paranoia. It concentrates where value is dense and oversight is thin: the bar, the walk-in, the loading dock at delivery time. The countermeasures are structural, not accusatory, locked storage for high-value items, receiving done by someone other than the person who ordered, variance reviewed item-by-item every week, and the visible fact that someone looks. Most shrinkage in most restaurants is process, not crime; but the process that catches waste is the same one that deters theft, which is why the operators who run it get both benefits for one habit. The same logic applies across every hotel cost line, as covered in our guide to managing hotel expenses.
Recipe Costing: Reprice the Menu Before It Reprices You
Every plate on the menu has a cost, and in 2026 that cost is a moving target. Recipe costing is the discipline of knowing it: every dish broken into ingredients, every ingredient priced at the latest invoice, every plate cost divided by its menu price to give a per-item food cost percentage. The payoff is twofold. First, it is the input for theoretical usage, without costed recipes there is no variance analysis. Second, it is your early-warning system: when beef rises 9 percent, the burger that made money in January can be losing it by July, and the only way to know is to have the recipe costed and the alert set.
Re-cost quarterly as a floor, monthly for volatile categories, and let the results feed menu engineering: the stars you promote, the dogs you retire, the plates where a small price move or a garnish change restores the margin. This is also where integrated systems quietly pay for themselves, when supplier invoices, recipes and the point of sale share one database, plate costs update as prices change instead of living in a spreadsheet whose last edit date nobody wants to check.
Inventory in a Hotel Restaurant: POS, Folios and the Ledger
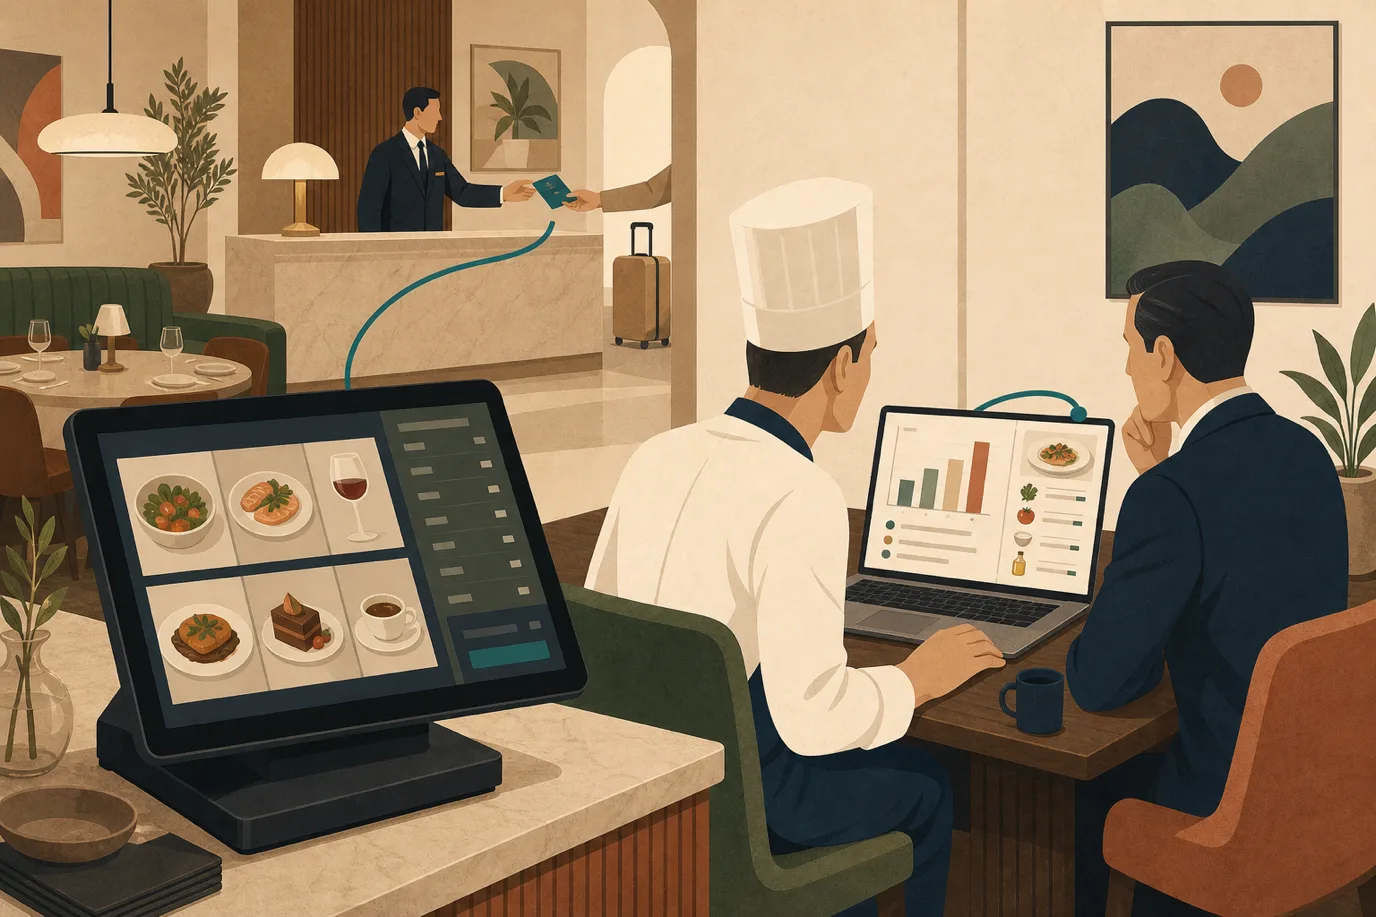
A hotel restaurant runs every discipline above plus one integration layer that standalone restaurants never see. Revenue arrives through more doors, walk-ins paying at the table, guests charging to the room, breakfast covers pre-sold inside a rate plan, banquet and event business booked months ahead, and every one of those doors has to post correctly for the food cost denominator to mean anything. A room-charge that never reaches the folio is not just lost revenue; it silently inflates your food cost percentage, because the product was consumed and the sale never landed. That posting path, and what it costs when it runs through a fragile interface, is the subject of our POS-PMS integration guide.
The integrated version is structurally simpler: a point of sale that lives in the same platform as the PMS posts charges to folios natively, decrements recipes as tickets fire, and hands F&B revenue to the accounting layer with outlet-level detail, no export, no reconciliation spreadsheet, no month-end argument between the chef's numbers and the controller's. Covers can be forecast from occupancy, production sheets from covers, orders from pars, and the morning report can show F&B revenue, food cost and variance beside RevPAR, where the general manager will actually read them. The wider revenue context, how F&B fits into the hotel's total commercial picture, is covered in our guide to food and beverage revenue in hotels.
Banquets deserve one specific mention: event business is the best inventory news in the building, known covers, known menus, weeks of notice, and the worst-managed in practice, because the banquet kitchen often orders outside the par system. Fold event orders into the same purchasing flow, cost the banquet menus like any recipe, and the highest-margin covers in the hotel stop leaking at the loading dock.
A Weekly Routine You Can Actually Keep
The whole system compresses into a rhythm that costs a manager roughly two hours a week. Monday morning, count the top items before the delivery and enter the counts at the shelf. Monday afternoon, review the variance report item by item, pick the single worst line, and assign it an owner and an action, retrain the portion, fix the par, lock the shelf, and check last week's action actually moved the number. Midweek, place orders by subtracting counts from pars, and receive against invoices with the scale out. Friday, glance at the food cost trend beside sales and labor, prime cost on one page, and flag anything drifting before it compounds. Quarterly, re-cost the recipes, recalculate the pars, and walk the storeroom layout so the count sheets still match the shelves.
None of this is glamorous, and that is rather the point: inventory management is a habit with a spreadsheet, or better, a habit with a system that fills the spreadsheet itself. The kitchens that keep the habit hold variance under 2 points, know their plate costs to the cent, and greet commodity inflation with a reprice instead of a shock. The kitchens that do not are donating 3 to 5 points of sales to the bin, the ladle and the back door, every week, invisibly.
Key Takeaways
Food cost is the most controllable number in the restaurant, and inventory is where it is controlled. The core is four numbers: food cost percentage (28 to 35 percent for most full-service concepts, median near 32), category-level COGS built on real counts, actual-versus-theoretical variance held under 2 points, and prime cost held between 55 and 60 percent of sales.
Par levels turn ordering into subtraction and deserve quarterly recalculation from actual usage. The counting rhythm that survives real operations is top-value items weekly, full house monthly, same day, same sequence, recorded at the shelf. Variance analysis converts an abstract percentage into named, fixable leaks, overproduction, portioning, spoilage, unlogged consumption and theft, and the waste log by the pass is the cheapest control in the industry. Recipe costing, refreshed quarterly, is both the input for variance and your defence against 2026's commodity inflation.
In a hotel, the extra discipline is the posting path: every cover must land on a folio or a payment, because unposted revenue reads as inflated food cost. An integrated platform closes that loop natively, POS to folio to ledger, recipes decremented per ticket, covers forecast from occupancy. If your current stack cannot put food cost, variance and covers on the same morning report as your room revenue, a Prostay demo will show you what the connected version of this system looks like in practice.