Ask a hotelier what their average daily rate was last month and they will have it in seconds. Ask how far ahead their guests book, and how that has changed since last year, and you usually get a shrug. Yet the booking window, the gap between the day a reservation is made and the night it is for, is one of the most decision-useful numbers a property owns. It tells you when demand for a given date is going to show up, which means it tells you when to hold rate, when to nudge it, and when to stop waiting and fill the room. A revenue management system lives or dies on reading this pattern well, and most manual pricing goes wrong because it ignores it.
The reason the window gets overlooked is that it feels abstract next to occupancy and rate. It is not. Every time a date arrives half empty that you could have sold, or sells out sixty days early at a rate you later realise was ten percent light, the booking window was trying to tell you something and nobody was listening. Lead time also differs sharply by where the booking comes from, so it is tangled up with your channel mix and the way you manage distribution through a channel manager. Read the two together and a lot of pricing decisions that felt like guesswork start to have an obvious answer.
One disclosure before the detail. I write for Prostay, so the short section near the end about how our own product handles this is interest, not neutral advice, and it is labelled as such. Everything before it is true whatever software you run, including a spreadsheet.
What the Booking Window Actually Is
Start with the two words people use interchangeably, because the difference matters once you try to act on them. Lead time is a property of a single booking: the number of days between when it was made and the arrival date. A reservation made today for a stay in six weeks has a lead time of 42 days. The booking window is the pattern those lead times form across many bookings, for a property, a segment or a date. People quote it as an average, and the average is the least interesting thing about it.
Here is why. Imagine two hotels that both report a 45-day average booking window. The first takes almost all its bookings around six weeks out: a tidy, predictable bell. The second books half its rooms to groups four months ahead and the other half to walk-ins inside three days, and the two halves average out to 45. Those hotels need completely different pricing, different staffing and different nerves, and the average hides that entirely. The shape of the distribution, how bookings are spread from far-out to last-minute, is the thing worth understanding. The average is a headline that often misleads.
So when this article talks about reading your booking window, it does not mean memorising one number. It means knowing the curve: what share of your final bookings for a date is typically already on the books at ninety days out, at sixty, at thirty, at fourteen, at seven, and on the day. That curve is what turns a scary empty calendar into a readable one, because it tells you whether a date that looks quiet today is actually behind, or exactly where it should be for this far out.
Why Lead Times Shifted, and Why They Are Not One Trend
You will hear that booking windows have collapsed, that everyone books last minute now. That is half true, and the half that is wrong will cost you money if you believe it wholesale. Several real forces did push lead times in. Flexible and free-cancellation rates let a traveller book early to secure a room and then rebook if a better price or plan appears, which frays the old link between an early booking and a committed guest. Mobile changed behaviour, making a same-week or same-day booking feel normal rather than risky. And years of disruption, from weather to health scares to economic wobble, taught a lot of people that waiting costs little and sometimes pays.
But the trend is not uniform, and treating it as one number for the whole property is the mistake. Resort and holiday demand still books months ahead, because people plan trips around flights and time off. Groups, weddings and corporate events book further out than ever for the dates they care about. And in genuinely high-demand markets and peak periods, scarcity pushes lead times back out, because travellers learn that if they wait, there is nothing left. So the honest summary is not shorter everywhere. It is more spread: a wider distribution, with a fatter last-minute tail than a decade ago, sitting alongside an early-booking segment that is still very much there.
That is why the useful work is always on your own data, split sensibly, rather than on a headline about the industry. Your resort weeks and your midweek city nights are almost certainly telling opposite stories. The property that reads each of them separately can act on both; the one that averages them into a single window acts correctly on neither.
Reading Your Own Booking Curve
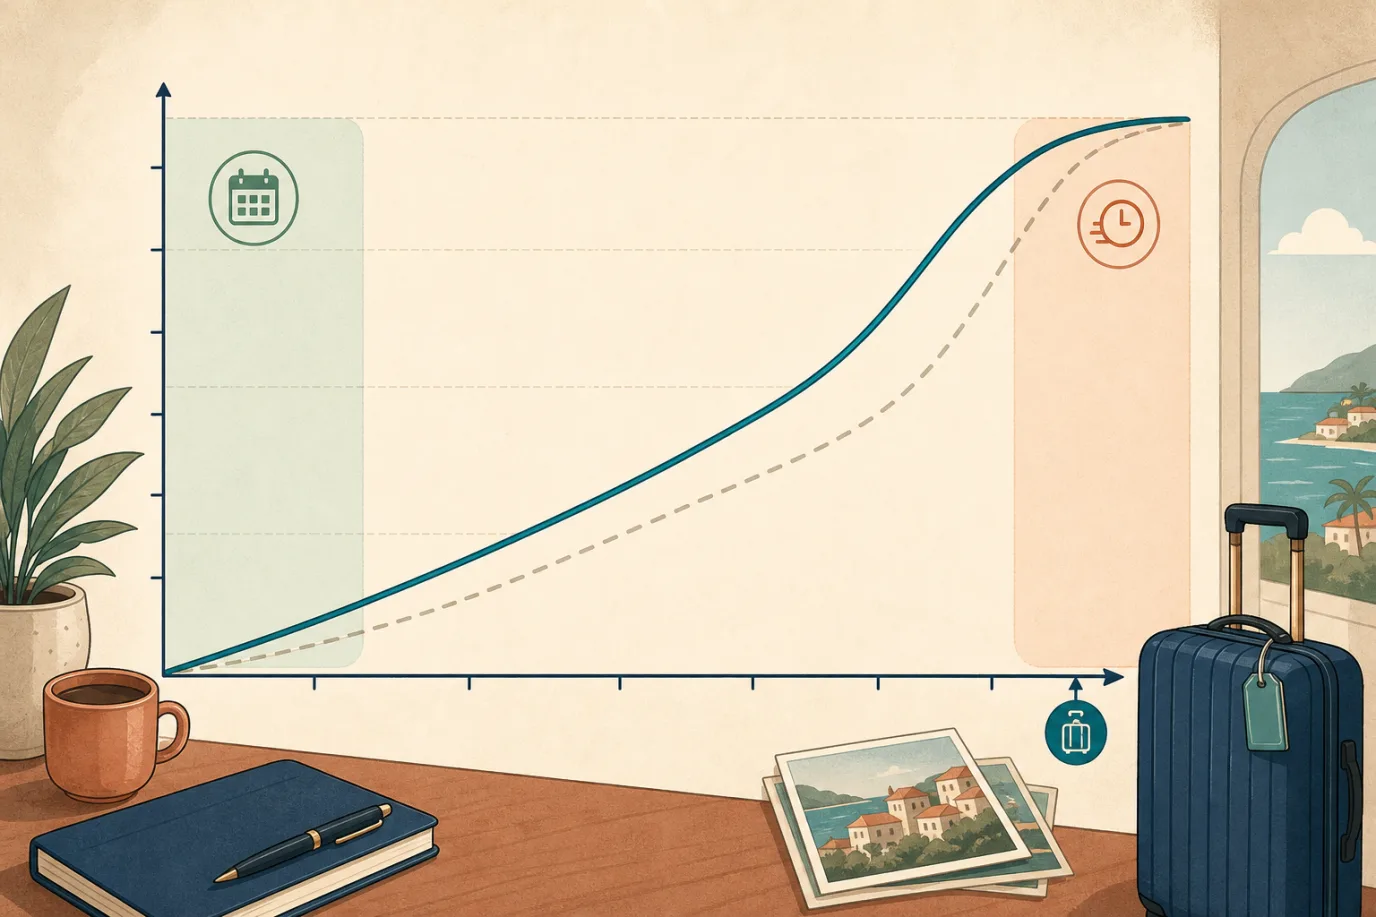
The booking curve is the practical form of all this, and it is the single most useful chart in revenue management that most independents never build. Plot, for a given date or period, the share of final bookings that is on the books against the number of days before arrival. It climbs from near zero far out to one hundred percent on the night, and the shape of that climb is your fingerprint. Once you know the normal shape, any future date can be read against it: sitting above the line means you are ahead of pace, below means behind, and the gap tells you how hard to push on price.
Pace, Pickup and Pace Versus Last Year
Three words carry most of the meaning here. Pace is how quickly bookings are accumulating for a future date compared with how they normally accumulate. Pickup is what you added in a defined recent period, the rooms picked up in the last seven days for August, say. And pace versus last year, often written as versus same time last year, compares where a date stands now against where the equivalent date stood at the same distance out a year ago. That last comparison is the one that keeps you honest, because raw occupancy for a future date is meaningless without knowing how it compares to a normal build at this lead time.
The trap to avoid is reading today's on-the-books number in isolation. Thirty percent booked for a date looks alarming until you realise that date is ninety days out and you are normally twenty percent booked at ninety days, in which case you are ahead and should probably be holding or lifting rate, not panicking into a discount. Pace turns a static, frightening number into a moving, informative one.
The On-the-Books Position
On the books simply means confirmed reservations you currently hold for a future date: rooms and revenue already committed. On its own it is a snapshot. Combined with the curve, it becomes a forecast, because if you know you normally hold half your final bookings at thirty days out and you are holding half now, you can reasonably project the finish. The discipline is to always ask two questions together: how much do I have on the books, and how much should I have on the books at this distance from arrival. The answer to the second lives in your curve.
Lead Time Is Not One Number: Segment and Channel Split It
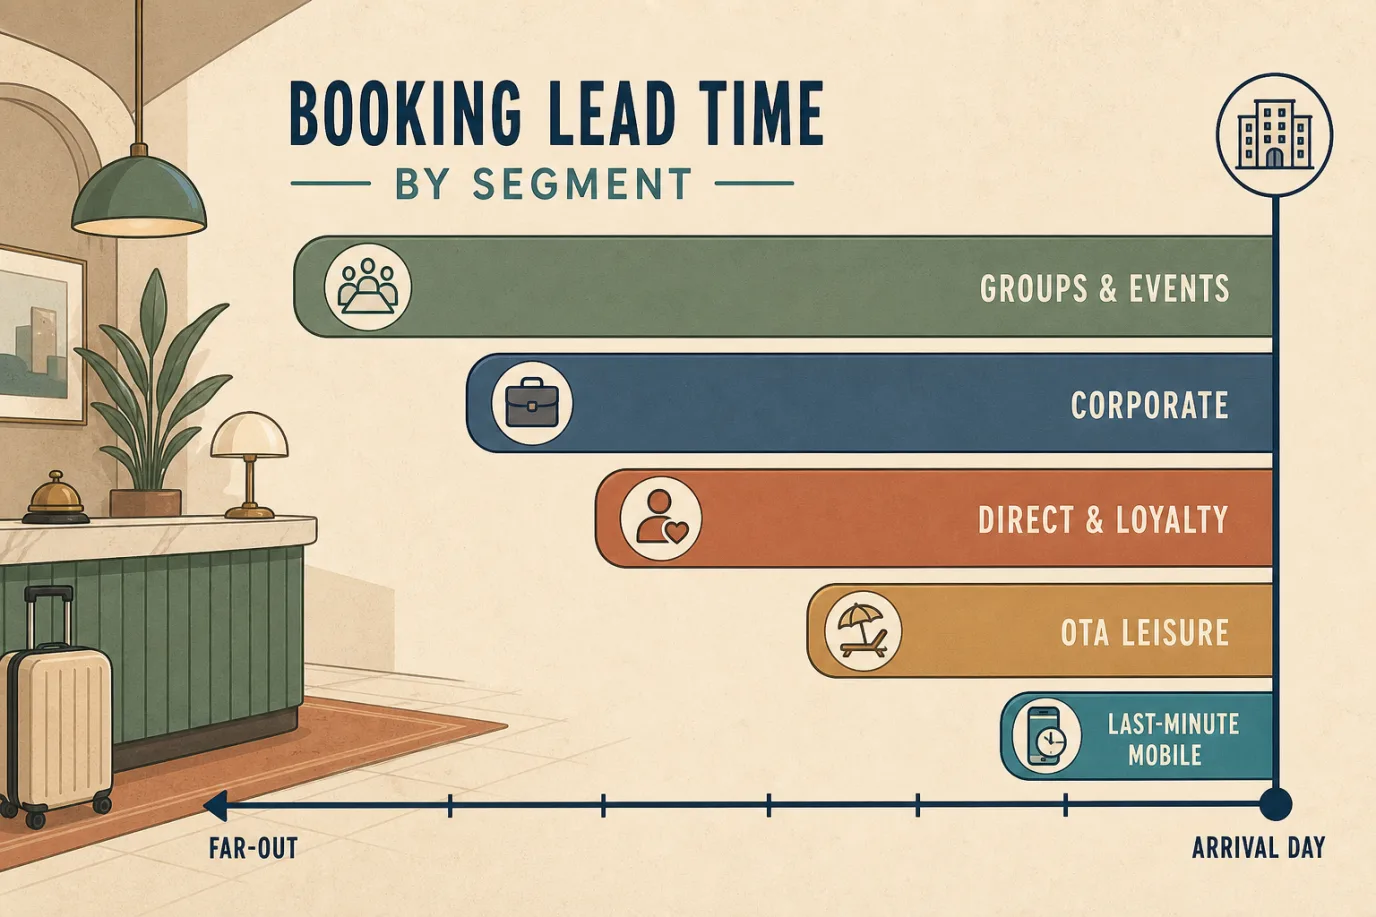
The single biggest upgrade to how most hotels think about the booking window is to stop treating it as one curve and start seeing several, one per segment and channel, laid over each other. They have genuinely different shapes, and the differences are stable enough to plan around.
Groups and events sit furthest out, often three months to well over a year, because they are built around fixed dates and logistics. Corporate and negotiated business books in a middle band, frequently a couple of weeks to a month or two, and tends to be steadier and less price-sensitive. Direct and loyalty guests usually plan a little earlier than your average leisure booker and cancel less, which is part of why they are worth more than their headline rate suggests. OTA leisure demand clusters nearer to arrival, and the pure last-minute segment, heavily mobile, lands inside a week and sometimes inside a day. None of these is better or worse; they are different instruments, and they arrive at different times.
Because channel and lead time are linked, two things follow that catch people out. First, a change in your channel mix silently changes your booking window: lean harder on OTAs and your average lead time shortens whether you meant it to or not. Second, a change in your window changes which channels matter for a date: a period that is behind pace with three weeks to go is a last-minute and OTA problem to solve, not a groups one. Reading segment and channel curves together is what lets you aim the right tool at the right date instead of pulling every lever at once.
Pricing Along the Curve: Early, Middle and Last Minute
Once you can read the curve, pricing stops being a single decision and becomes three modes that a date moves through as it approaches. The error most properties make is holding one rate posture across the whole window, either discounting early out of nerves or clinging to a high rate until the room goes empty. The booking window tells you which mode a given date is actually in.
Far from arrival, the job is to protect a sensible floor and capture genuine early planners without giving away demand you would have won anyway. A blanket early-bird discount is often a quiet mistake here, because a chunk of the guests taking it would have booked at full rate closer in. Early discounting is worth it only when your curve shows you are genuinely behind pace for that date, or when you deliberately want committed, non-cancellable revenue on the books to reduce risk.
In the middle of the window, you steer. This is where pace versus last year earns its keep: ahead of pace, you hold or lift rate and let the market come to you; behind pace, you either sharpen price or open a channel or segment you had been keeping closed. Close to arrival, you are in the endgame, deciding date by date whether to defend rate or convert an empty room into last-minute revenue, knowing an unsold room tonight earns nothing forever. Fences make this cleaner: non-refundable and advance-purchase rates reward early commitment, flexible rates carry the premium they deserve, and last-minute or mobile rates let you chase the tail without publicly discounting your headline price. Price is not one number across the window; it is a planned journey along it.
Forecasting From the Window, Not the Wall Calendar
Most small-hotel forecasting is really just looking at the calendar and feeling optimistic or worried. The booking window turns that feeling into a number. If your curve says you normally hold sixty percent of a date's final bookings at fourteen days out, and you are holding sixty percent now, your finish is roughly on track and you can project it. If you are holding forty, you are behind and the forecast should say so while there is still time to act. This is unglamorous arithmetic, and it beats intuition reliably enough that it is worth building even in a spreadsheet.
The forecast you get this way is not a single guess but a live projection that updates as bookings land. Each day, new pickup either confirms the trajectory or bends it, and the gap between where you are and where the curve says you should be is your early-warning system. A date drifting below its normal pace for a week running is telling you to act now, not to discover the shortfall when it arrives. Forecasting from the window means you are always looking at the finish line implied by today's position, not just today's raw number.
It also protects you from the opposite error, over-reacting to a date that merely looks empty because it is far out. A well-built curve gives you permission to leave a quiet-looking date alone when it is quiet exactly on schedule, and to move decisively on one that is genuinely lagging. Both of those are money: the first stops you discounting demand that was coming anyway, the second stops you sleepwalking into an empty night.
Cancellations and Deposits Bend the Window
There is a catch in all of this that has to be named, because it quietly distorts every curve: not every booking on the books will actually arrive. Flexible rates and free cancellation mean a reservation made ninety days out is a softer commitment than one made non-refundable at fourteen days. If a large share of your early bookings are cancellable, your on-the-books position far from arrival is optimistic, and a curve that ignores this will flatter you into holding rate when you should be building real, committed demand.
The fix is to read the window and the cancellation profile together. Track not just how many rooms are on the books at each distance, but how many of them are the kind that tend to stick. A date that looks healthy on gross bookings but is stacked with flexible, high-cancel-risk reservations is more fragile than it appears, and it may justify seeding some non-refundable rate or a deposit requirement to firm it up. Deposits and advance-purchase terms are not just cash-flow tools; they are how you convert a soft early booking into one you can actually forecast against.
This is also where cancellation policy design and the booking window meet. Push everyone to non-refundable and you shorten your effective window, because risk-averse planners wait rather than commit early to terms they cannot escape. Offer only flexible terms and you fill the books early with reservations that may evaporate. The sensible middle is a spread of rate types across the window, so early commitment is rewarded, flexibility is available at a fair premium, and your forecast is built on demand weighted by how likely it is to show up.
Turning the Window Into Action, By Distance to Arrival
All of this is only worth the effort if it changes what you do on a Tuesday morning. The cleanest way to make it operational is to think in three zones of the window and to know your default move in each, then let pace versus last year tell you when to break the default.
Far Out: Base Demand and Groups
In the far zone, months before arrival, your work is to lay a solid base and to win the business that genuinely books this early: groups, events, corporate contracts and the early leisure planner. Hold a defensible floor rate, chase group and corporate leads for the dates you want to anchor, and resist the urge to discount transient demand just because the calendar looks bare. It is supposed to look bare this far out. The only reason to sharpen price here is a date your curve shows is truly behind, or a strategic wish to bank committed, non-cancellable revenue against an uncertain period.
The Middle: Steering the Mix
The middle zone, roughly a month to a couple of weeks out for most transient demand, is where active revenue management happens. This is when pace becomes readable and reliable, so it is when you make your real rate moves: hold and lift on dates running ahead, sharpen or open channels on dates running behind. It is also where you manage mix deliberately, deciding whether to take more OTA volume to shore up a soft date or to protect availability for higher-value direct and corporate demand you expect to arrive. Most of the money in revenue management is made or lost in this zone, quietly, one date at a time.
Last Minute: Filling the Tail on Purpose
The last zone, the final days, is about converting empty rooms into revenue without wrecking your rate integrity. An unsold room tonight is worth nothing tomorrow, so a date still soft with days to go is a candidate for last-minute and mobile channels, targeted offers to your own past guests, and rate types that let you discount privately rather than dropping your public price. The skill is doing this on purpose, only for dates that are genuinely behind, rather than reflexively dumping rate on every approaching date and training your market to wait. Filling the tail is a scalpel, not a fire sale.
Where Prostay Fits, Honestly
The disclosure first, again: I write for Prostay, so read this as interest rather than neutral analysis. The honest, narrow point is that reading the booking window well is mostly a data problem, and the data has to come from somewhere clean. Because the property management system holds every reservation with its booking date and arrival date, the pace and pickup views, the curves by segment and channel, and the pace-versus-last-year comparison are all computable from data you already have, if it lives in one place rather than scattered across a PMS, a separate booking tool and an OTA extranet. Prostay builds those pace and pickup reports from the same system that takes the bookings, and the revenue tools act on the curve rather than on a static rate sheet.
That does not make Prostay the only way to do this. A disciplined revenue manager with a good extract and a spreadsheet can build a serviceable booking curve, and dedicated revenue management systems do this at more depth than any all-in-one will. The case for having it native is simply that the window is only as good as the data feeding it, and every hand-off between systems is a place for booking dates to go missing or channel tags to get muddled. The test to apply, to us as much as anyone, is concrete: can you pull a pace report for any future month, split by segment and channel, and see it against the same point last year, in under a minute, without exporting anything. If you can, you will price the window well. If you cannot, you are flying on the average, and the average is the number that lies.
Frequently Asked Questions
The questions revenue managers and owners ask most about the booking window and lead time, on what counts as normal, how to calculate it, why it moved and how it should drive price, answered from how these patterns actually behave in a real property rather than from a textbook.