

US hotels booked a record quarter in early 2026, and almost none of it came from doing more business. Accommodation revenue reached $89.8 billion in the first quarter, up 5.3 percent over the year. Room prices over roughly the same window rose 4.9 percent. Subtract one from the other and the entire industry grew real volume by something close to nothing. Meanwhile payrolls sit 188,400 people below February 2020, and labour productivity has fallen in three of the last four measured years. If your property management system reports look better than they feel, that gap is the reason.
Everything in this article comes from a named federal series. No STR licence, no vendor survey, no round numbers borrowed from another blog. That constraint costs us occupancy and ADR, which the government does not publish at all, and it buys something better: figures you can check yourself in about ten minutes, and that nobody has an interest in flattering. Used properly they tell you whether your own performance is a market effect or a management effect, which is the only benchmarking question worth asking and the one a revenue management system cannot answer from your own data alone.
What follows is the whole picture for the 2026 planning cycle: revenue, staffing, wages by role, churn, productivity, prices, inbound demand, and the structural detail on establishments, unions and injuries. Then the harder part, which is what these series deliberately leave out, and one significant source that stopped publishing this year.
Where the Official US Hotel Numbers Come From
Four publishers cover the industry between them. They do not agree on definitions, they release on different schedules, and each one measures something the others do not. Knowing which is which saves a lot of arguing about numbers that were never comparable.
| Source | What it measures | Coverage | Frequency |
|---|---|---|---|
| BLS Current Employment Statistics | Jobs, hourly earnings, weekly hours | NAICS 721 accommodation | Monthly |
| BLS Occupational Employment and Wage Statistics | Wages and headcount by job title | Occupations within the industry | Annual |
| BLS JOLTS | Openings, hires, quits, layoffs | Accommodation and food services combined | Monthly |
| BLS Consumer Price Index | What guests pay for lodging | Urban consumers | Monthly |
| BLS Producer Price Index | What operators receive | NAICS 721 | Monthly |
| Census Quarterly Services Survey | Revenue | Taxable accommodation establishments | Quarterly |
| BLS Quarterly Census of Employment and Wages | Number of establishments | NAICS 721 | Quarterly |
| NTTO, Department of Commerce | International arrivals and forecast | All inbound visitors | Monthly, plus annual forecast |
Two traps in that table are worth naming before we use any of it.
The first is JOLTS. It publishes accommodation and food services as a single industry, which means every turnover figure you are about to read includes quick service restaurants. Hotels are the minority of that population. The rate is directionally right for hotel work and it is the best official series available, but do not quote it as a hotel number, because it is not one.
The second is NAICS 721 itself. It is not a synonym for hotels. It includes RV parks, recreational camps, and rooming and boarding houses alongside traveller accommodation. Those subsectors are small next to hotels, so the aggregate moves with hotels, but a 60-room boutique property and a seasonal campground are being averaged together in every figure below.
Revenue: A Record Quarter That Is Mostly Price
The Census Bureau's Quarterly Services Survey is the closest thing the United States has to an official top line for the industry. It samples firms rather than properties, covers establishments subject to federal income tax, and feeds directly into the Bureau of Economic Analysis estimate of GDP. It is not a hotel industry report and it makes no attempt to be one, which is precisely why it is useful.
| Quarter | Revenue, seasonally adjusted | Revenue, unadjusted |
|---|---|---|
| Q1 2025 | $85.3bn | $79.1bn |
| Q2 2025 | $85.5bn | $89.0bn |
| Q3 2025 | $86.1bn | $91.8bn |
| Q4 2025 | $88.0bn | $84.9bn |
| Q1 2026 | $89.8bn | $83.5bn |
Read the seasonally adjusted column and the industry has grown for four consecutive quarters, ending 5.3 percent above where it started. Sum the unadjusted column and the twelve months to March 2026 produced about $349 billion of accommodation revenue.
The unadjusted column also puts a number on seasonality that most operators feel but rarely quantify. The gap between the strongest quarter and the weakest, $91.8 billion against $79.1 billion, is roughly 16 percent of the trough. That is the national average across every property type and climate in the country, which makes it a floor rather than a benchmark. If your own peak-to-trough spread is 16 percent you are unusually flat. Most independent properties are considerably worse, and the ones that are not have usually built a second season deliberately.
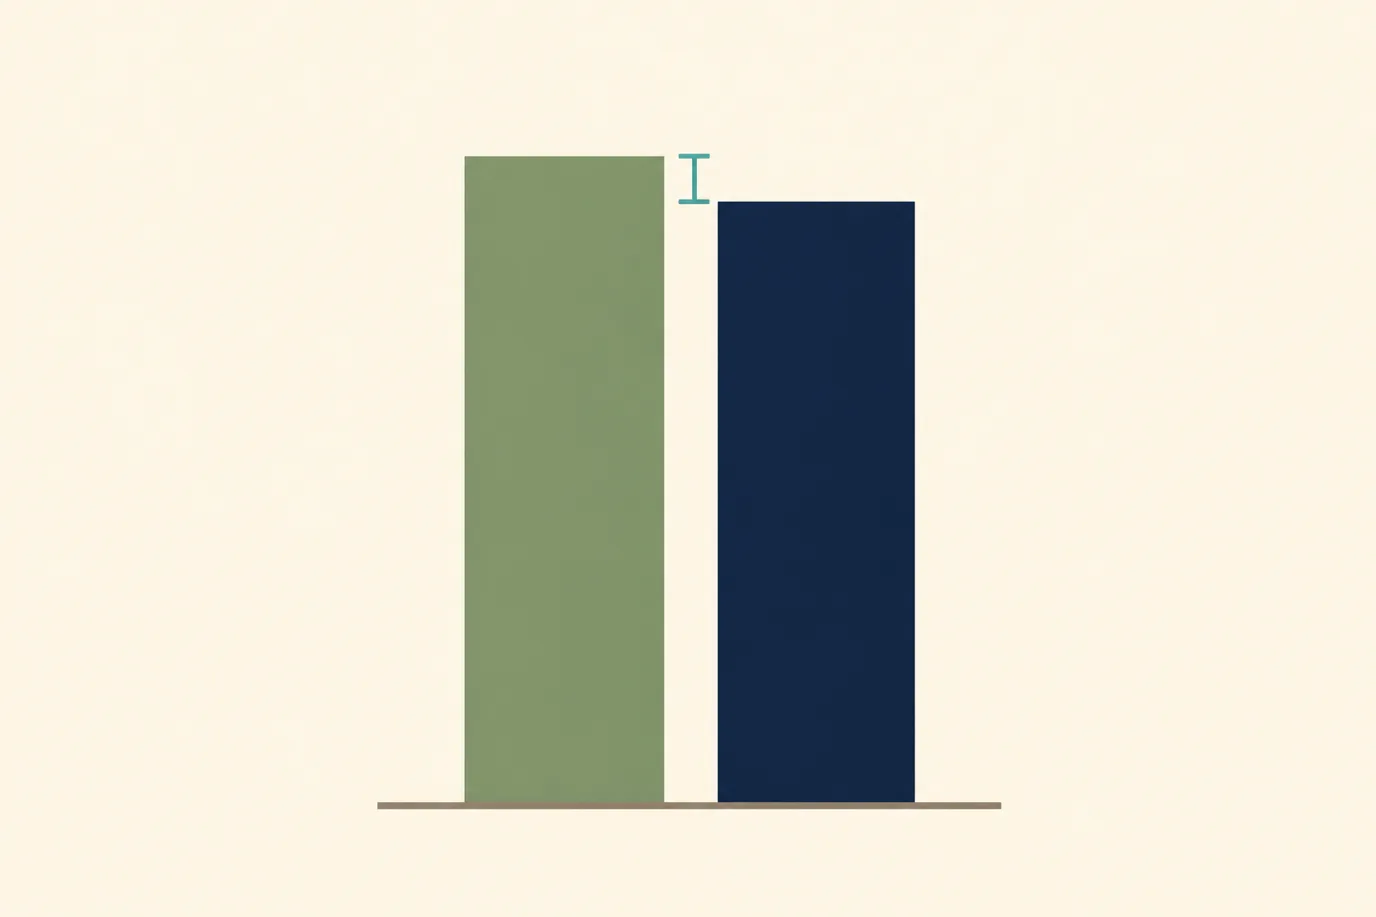
Now the part the headline number hides. Over roughly the same period, the consumer price index for lodging away from home rose 4.9 percent. Revenue rose 5.3 percent. The two series are not perfectly aligned, they cover different periods and slightly different populations, and this is a derived comparison rather than a published statistic. Treat it as an approximation and it still says something hard to argue with: nearly all of the revenue growth in US accommodation over the past year was rate, and real volume moved by a fraction of a percent.
That matters for how you read your own year. A property up 5 percent on last year has, on these numbers, performed at market. It has not grown. It has repriced, along with everybody else, and it will keep pace exactly as long as the pricing environment holds.
Staffing: 188,000 People Short of February 2020
Accommodation employment stood at 1,919,400 in July 2026, seasonally adjusted and preliminary. February 2020, the last clean month before the industry lost three quarters of a million jobs in eight weeks, was 2,107,800.
| Month | Accommodation employment |
|---|---|
| February 2020 | 2,107,800 |
| April 2020 | 1,199,100 |
| April 2026 | 1,924,100 |
| May 2026 | 1,938,200 |
| June 2026, preliminary | 1,916,800 |
| July 2026, preliminary | 1,919,400 |
Six years and four months after the collapse, the sector is still 188,400 jobs short. The recovery curve did most of its work by 2023 and has been close to horizontal since. Employment has now sat between roughly 1.91 and 1.94 million for three solid years, drifting sideways through what were, on the revenue line, record quarters.
There is a comfortable reading of this and an uncomfortable one, and the honest answer is that the official data cannot distinguish between them. The comfortable reading is that hotels got more efficient: automation, self-service, better tooling, fewer people needed. The uncomfortable one is that hotels never refilled the roles and have been running short-staffed for three years, with the cost showing up in service scores and staff churn rather than on the payroll line.
The productivity series settles it later in this article, and it does not settle it in the industry's favour.
One caution on these figures. The June and July numbers are marked preliminary, and BLS revises the two most recent months as standard practice as more employer reports arrive. Revisions of 20,000 to 30,000 in either direction are routine at this level of detail. Do not build a story on a single month, which is a discipline worth applying to your own reporting too.
What Hotel Work Pays in 2026
Average hourly earnings across all accommodation employees were $25.41 in May 2026, on average weekly hours of 30.5. Production and non-supervisory employees, which is most of the building, averaged $22.41 on 29.4 hours.
Those weekly hours deserve a moment. At 30.5 hours the average accommodation job is not a 40-hour job. Some of that is genuine part-time work by choice, and a good deal of it is scheduling built around variable occupancy. Either way, an hourly rate that looks reasonable produces a weekly figure that often does not, and that arithmetic drives a large share of the churn covered in the next section.
The decade view is the striking one. Average hourly earnings in accommodation were $17.10 in December 2016 and $25.45 in December 2025. That is a rise of just under 49 percent in nine years.
Occupational detail comes from a different BLS programme, released annually, with 2025 as the most recent complete year.
| Occupation | Median hourly | Median annual | Employed, 2025 |
|---|---|---|---|
| Maids and housekeeping cleaners | $16.78 | $34,900 | 420,800 |
| Hotel, motel and resort desk clerks | $16.82 | $34,990 | 247,700 |
| Waiters and waitresses | $17.06 | $35,490 | 143,620 |
| Housekeeping and janitorial supervisors | $21.94 | $45,640 | 40,380 |
| Lodging managers | $32.27 | $67,110 | 38,100 |
One number in that table is not what it appears. The median wage for lodging managers is $32.27 an hour, but the mean is $37.08. A gap that wide between median and mean means the distribution has a long tail: a relatively small population of highly paid managers at large or luxury properties pulling the average up, above a much larger group earning near the median. If you are benchmarking a general manager salary against the mean, you are almost certainly benchmarking against a different kind of hotel than yours.
The Two Jobs That Set Hotel Payroll
Housekeeping cleaners and desk clerks together account for 668,500 of the roles BLS tracks in this industry, and they sit within four cents an hour of each other at the median. Every other role is a rounding error against those two by headcount.
This is the practical consequence, and it is the thing most rate strategy quietly ignores. When a state or city raises its minimum wage, or when the local labour market moves, it moves both of those numbers at once, across your entire operation, immediately. There is no gradual pass-through and no negotiating position. A dollar an hour on 420,800 housekeeping cleaners nationally is roughly $850 million a year in wages before any payroll tax, and at a single 100-room property it is the difference between a viable housekeeping model and a rewritten one.
It also explains why hotels reach for outsourcing and for room attendant productivity targets before almost anything else, and why the productivity numbers later in this piece are so uncomfortable. Those two roles are where the money is, so they are where the pressure lands.
Churn: Quits at More Than Twice the National Rate
JOLTS is the series that makes hospitality look like a different economy from everywhere else. Remember the caveat: this is accommodation and food services combined, so restaurants are in the numbers.
| Measure, June 2026 | Accommodation and food services | All industries |
|---|---|---|
| Quits | 638,000 (4.5%) | 3.2m (2.0%) |
| Hires | 816,000 (5.7%) | 5.3m (3.4%) |
| Total separations | 715,000 (5.0%) | 5.4m (3.4%) |
| Job openings | 684,000 (4.6%) | 7.4m (4.4%) |
The quits rate is the one to sit with. At 4.5 percent against a national 2.0 percent, people leave hospitality jobs voluntarily at more than twice the rate they leave work generally. Annualised naively, a 4.5 percent monthly quits rate implies replacing more than half the workforce in a year through voluntary departures alone, before a single layoff or dismissal.
Hires at 816,000 exceeded separations at 715,000, so the sector was still growing on net. That combination, very high churn alongside modest net growth, is the signature of an industry running hard to stay in place. Roughly nine people were hired for every eight who left, and the eighth one took their training, their knowledge of your building, and their relationships with your regulars out of the door with them.
Job openings fell by 68,000 over the month, which is the softest signal in this dataset. Fewer open roles alongside continued high quits usually means employers pulling back on hiring rather than workers settling down.
The Productivity Line Nobody Reads
BLS publishes productivity measures for accommodation, and this is where the story stops being ambiguous. These are annual percent changes, with 2024 the most recent published year.
| Measure | 2021 | 2022 | 2023 | 2024 |
|---|---|---|---|---|
| Labour productivity, output per hour | +26.9% | -9.3% | -1.9% | +0.3% |
| Total factor productivity | +21.1% | -7.8% | +0.1% | +3.2% |
| Output | +36.6% | +10.2% | +3.4% | +1.4% |
| Labour input | +6.7% | +20.8% | +5.0% | +2.0% |
| Capital input | -1.4% | -1.0% | 0.0% | -0.4% |
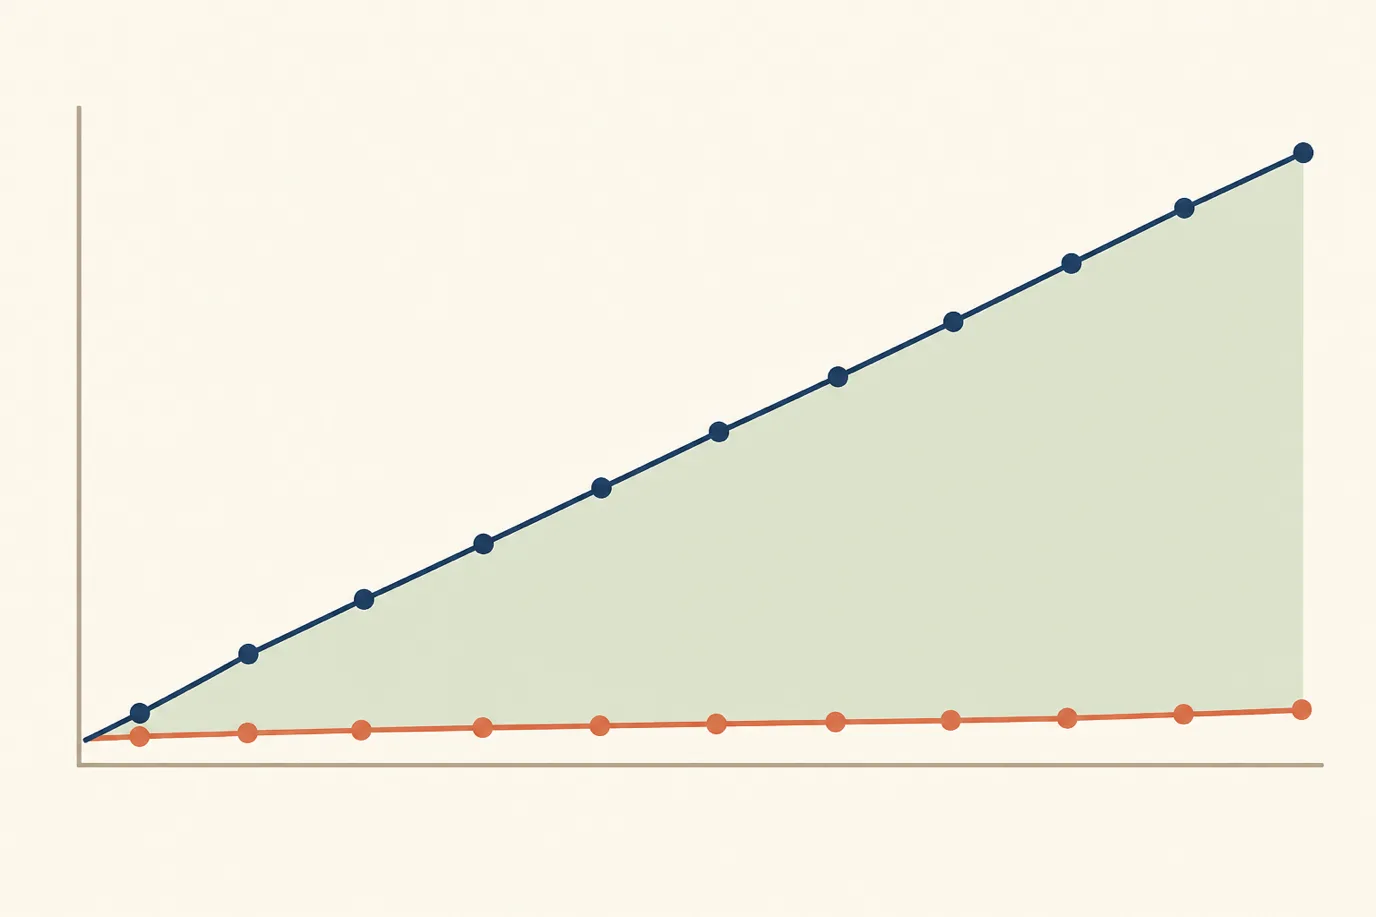
Read the labour productivity row across. Output per hour fell 9.3 percent in 2022, fell again in 2023, and recovered 0.3 percent in 2024. Compounded, output per hour in US accommodation finished 2024 roughly 11 percent below its 2021 level.
The 2021 figure is not a triumph, incidentally. Productivity looks spectacular that year because hotels were running skeleton crews against returning demand. It is the artefact of an emergency, not a model.
What happened next is the real finding. In 2022 the industry added 20.8 percent more labour input to produce 10.2 percent more output. In 2023 it added 5.0 percent more hours for 3.4 percent more output. In 2024, 2.0 percent more hours for 1.4 percent more output. Three consecutive years of putting in hours faster than the work came out.
Then look at the capital input row, which is the one nobody quotes. It is negative or flat in every single year: down 1.4 percent, down 1.0 percent, unchanged, down 0.4 percent. Over four years the industry's capital base shrank by roughly 3 percent in real terms while its labour input grew by close to a third.
That is the whole argument in two rows of a government table. Faced with recovering demand, US hotels bought labour instead of capability, and got less out of every hour as a direct result. Total factor productivity turning positive in 2024, up 3.2 percent while output per hour barely moved, hints that the tide may be turning. One year is not a trend.
Prices: Two Federal Indexes That Disagree
The government measures hotel prices twice, from opposite ends of the transaction, and in June 2026 the two measurements pointed in different directions.
The consumer price index for lodging away from home fell 2.3 percent over the month and rose 4.9 percent over the year. The narrower index for other lodging including hotels and motels fell 2.8 percent on the month and rose 4.8 percent on the year. The producer price index for accommodation, meanwhile, rose 2.9 percent in the same month, after falling 1.8 percent in April and rising 1.2 percent in May.
A monthly decline of 2.3 percent alongside a monthly rise of 2.9 percent looks like an error. It is not. CPI measures what urban consumers pay and is seasonally adjusted. PPI measures what producers receive, is not seasonally adjusted at this level, and includes business and negotiated rates that never appear in a consumer basket. In a June, with leisure season loading and corporate rates static, the two genuinely diverge.
The practical guidance is to use them for different questions. CPI year over year, currently 4.9 percent, is your best free proxy for what the rate environment did to a leisure-heavy property. PPI is closer to what a mixed-business hotel actually realised. Neither is ADR, neither is occupancy, and neither knows anything about your market.
Worth noting for context: lodging away from home carries a relative importance of 1.483 percent in the CPI basket. Hotel rates are a rounding error in national inflation, which is why they get almost no attention when CPI is discussed, and why the series is unusually clean. Nobody is managing it.
Inbound Demand: 2019 Arrives in 2029
The National Travel and Tourism Office, part of the International Trade Administration at the Department of Commerce, is the official US source on inbound visitors. Its Spring 2026 forecast is the government's own view of the next five years.
| Year | International arrivals | Change |
|---|---|---|
| 2025 actual | 68.3m | |
| 2026 forecast | 70.5m | +3.2% |
| 2027 forecast | 74.1m | +5.2% |
| 2028 forecast | 78.7m | +6.1% |
| 2029 forecast | 82.3m | +4.7% |
| 2030 forecast | 85.2m | +3.5% |
The United States received about 79 million international visitors in 2019. On its own government's forecast it does not clear that mark until 2029. The 2028 projection of 78.7 million still falls just short, a decade on.
That is a full decade of lost inbound growth, and it is the single most important line in this article for any property with meaningful international mix. The World Cup carries 2026 and the Los Angeles Olympics support 2028, and even with both, recovery to the previous peak takes until the end of the decade.
The monthly detail shows how uneven it is. January 2026 brought 5,412,343 international visitors, down 3.5 percent on January 2025 and equal to 92.7 percent of the January 2019 figure. Canada alone supplied 1,187,286 of them, and the top five source markets accounted for 66.3 percent of all arrivals.
The forecast by market is where planning decisions actually live. For 2026, NTTO expects Mexico and Brazil up 5.8 percent each, Japan up 4.5 percent, the United Kingdom and China up 3.5 percent, Germany up 2.1 percent, Italy roughly flat at 0.3 percent, France down 1.0 percent and India down 4.1 percent. If your marketing spend is distributed evenly across Europe, the government's own forecast says half of that money is pushing against the current.
Establishments, Unions and Injury Rates
Three smaller series that rarely make the trade press, each of which changes a decision somewhere.
Establishments. The Quarterly Census of Employment and Wages counted 78,788 private accommodation establishments in the fourth quarter of 2025, up from 78,038 in the first quarter of that year. Roughly 750 net new establishments in a year, on a base of 78,000, is growth of about 1 percent. Set that against employment which did not grow at all, and the average establishment is slightly smaller than it was.
Union representation. 7.6 percent of accommodation wage and salary workers were union members in 2025, with 8.3 percent covered by an agreement, up from 6.9 and 7.3 percent in 2022. Median usual weekly earnings for full-time workers were $962 for union members against $887 for non-union, a premium of about 8.5 percent. The 2025 union figures are eleven-month averages, because October data was not collected during the federal government shutdown, which is the sort of footnote worth carrying if you plan to quote them.
Injuries. In 2024 the industry recorded 2.3 cases per 100 full-time workers involving days away from work, job restriction or transfer, with 1.2 of those involving days away. There were 42 work-related fatalities, up from 33 in 2023. Housekeeping is physically demanding work performed largely by a workforce earning $16.78 an hour at the median, and the injury rate is the cost of the rooms-per-shift target that nobody puts in the labour model.
What the Official Data Refuses to Measure
Being straight about the limits is what makes the rest usable. The federal statistical system does not publish, and has never published, occupancy rate, average daily rate, RevPAR, market segmentation, channel mix, guest satisfaction, hotel pipeline by segment, or anything at property or competitive-set level.
Those are commercial products. Occupancy, ADR and RevPAR come principally from STR, now part of CoStar, built from participating hotels submitting their own data in exchange for benchmark reports. That is a genuinely good dataset and there is no free equivalent. If you need a competitive set benchmark, you need a subscription, and no amount of federal data substitutes for it.
What the official series do instead is answer a different and arguably more important question. STR tells you how you performed against the hotel down the road. The government tells you what happened to the whole industry's costs, prices, labour supply and demand base. A property can beat its competitive set every month while sitting inside a sector whose productivity is falling and whose capital base is shrinking. The first fact is about this year. The second is about whether the business still works in five.
There is one more gap worth naming. None of these series say anything at all about independent hotels as distinct from brands, or about small properties as distinct from large ones. Everything here is an average across 78,788 establishments ranging from roadside motels to convention hotels. Use it as context, never as a target.
The Series BEA Just Stopped Publishing
In February 2026 the Bureau of Economic Analysis posted a short notice on its travel and tourism page: it will no longer regularly produce these statistics.
The Travel and Tourism Satellite Account was the most sophisticated official measurement of tourism's role in the US economy. It ran on the same methods as GDP, covered 24 categories of visitor spending, and separated direct from indirect output. The final release, published in February 2025, covered 2018 to 2023. In 2023 it put travel and tourism value added at $840 billion, or 3.03 percent of GDP, on real output growth of 7.0 percent after a 20.8 percent rebound in 2022. Total tourism-related output reached $2.64 trillion, split between $1.52 trillion direct and $1.12 trillion indirect, a ratio of 1.73 that quantified how much of the wider economy each tourism dollar pulled along with it.
That series has now stopped, and nothing has replaced it. Anyone who needs to argue the economic case for tourism to a local authority, a lender or a planning board has lost their best-quality citation and is left with 2023 as the most recent official figure they will ever have.
The lesson generalises beyond this one dataset. Official series get discontinued, redefined and rebased, usually with little notice. If a number matters to your business, record where it came from and when you pulled it. The BEA figures above are still perfectly good for 2023. They will simply never be updated.
How to Read This Against Your Own P&L
National averages are not targets. What they are good for is separating market effects from management effects, and there are four checks worth running before your next budget conversation.
Check your revenue growth against 5.3 percent, then against 4.9 percent. If you grew below 5.3 percent you lost share. If you grew above it, subtract the roughly 4.9 percent that was rate and see what remains. That residual is the only part you actually earned. Most properties find it is small, and finding it is small is far more useful than a congratulatory year-on-year chart.
Work out your own revenue per employee. Across the industry, $349 billion of annual revenue against about 1.92 million employees gives roughly $182,000 per employee. That is our arithmetic, not a published statistic, and it mixes full and part-time workers, so treat it as a rough marker rather than a benchmark. Run the same calculation on your own numbers. A meaningful gap in either direction is worth understanding rather than celebrating: well above may mean a lean operation, or it may mean you are the reason your quits rate looks like the national one.
Compare your wage rates to the medians, by role, not in aggregate. Housekeeping at $16.78 and front desk at $16.82 are national medians across every market in the country, which means half of all such workers earn less. In a metropolitan market you should expect to be well above them. If you are at or below the national median in a high-cost market, your recruitment problem is not a recruitment problem.
Look at your capital line for the last four years. The industry's capital input has been flat or negative in each of them while labour input grew by close to a third. If your own pattern matches, you have been solving capacity problems by adding hours. That works until the hours cost 49 percent more than they did in 2016, which they now do.
What to Do With This Before 2027 Budgets
Three conclusions come straight out of the data, and none of them require agreeing with any particular vendor about anything.
The first is that rate has been doing the work, and rate-driven growth ends when the pricing environment does. A plan built on repeating this year's 5 percent needs to say explicitly where it comes from, because the last one came almost entirely from price, and prices at 4.9 percent annual growth in a 3 percent inflation economy are not a permanent condition.
The second is that the labour model is the business model now. Two occupations set the payroll, they sit within four cents of each other, and they turn over at more than twice the national rate. Every operational decision that reduces the number of hours needed to serve a room, or that keeps an experienced person for another year, compounds against a wage line that has risen by half in nine years and shows no sign of stopping.
The third is the uncomfortable one. For four consecutive years the industry answered recovering demand with more hours and less capital, and its own productivity numbers show exactly what that bought: output per hour about 11 percent below where it started. The 2024 total factor productivity reading of plus 3.2 percent is the first sign of anything different. Whether that becomes a trend depends on decisions being made in budget meetings right now, in individual hotels, one capital line at a time.
Sources
Every figure above comes from one of the following, retrieved on 10 August 2026.
- BLS, Industries at a Glance: Accommodation, NAICS 721. Employment, average hourly earnings, weekly hours, occupational wages and headcount, establishment counts, union coverage, injury and fatality rates, producer prices, and the productivity table.
- BLS, Current Employment Statistics, series CES7072100001 and CEU7072100003. Monthly accommodation employment and average hourly earnings, with history back to 2016.
- BLS, Occupational Employment and Wage Statistics, 2025 estimates. Median and mean wages and employment by occupation.
- BLS, Job Openings and Labor Turnover Survey, June 2026 release, tables 1 to 4. Openings, hires, total separations and quits for accommodation and food services.
- BLS, Consumer Price Index, June 2026 release, tables 6 and 7. Lodging away from home, and other lodging including hotels and motels.
- US Census Bureau, Quarterly Services Survey, first quarter 2026. Total revenue for NAICS 721 accommodation, adjusted and unadjusted.
- National Travel and Tourism Office, International Trade Administration, US Department of Commerce, Spring 2026 International Visitor Forecast. Arrivals and the 2026 to 2030 outlook by market.
- Bureau of Economic Analysis, Travel and Tourism Satellite Account for 2018 to 2023, published February 2025 and discontinued February 2026.
Two figures in this article are ours rather than theirs: revenue per employee, and the split of revenue growth between price and volume. Both are simple arithmetic on the series above, and both are flagged where they appear.