The 90-day forecast you ran on Monday is already wrong by Tuesday morning. The honest question is not whether the forecast was wrong, it is by how much, where the error came from, and whether you would even notice if it doubled. For most independent hotels we audit, the answer to the third question is no, and that is the real problem this article is trying to solve.
Demand forecasting is the oldest discipline in hotel revenue management and the one with the largest gap between what the academic literature says works and what hotels actually do on a Tuesday morning. The literature is rich, the vendor landscape is loud, and the in-the-trenches practice is mostly spreadsheets, gut feel, and a quarterly visit from a consultant who left the deck behind. This article is a practical, sourced, opinionated read on the methods that actually perform on hotel-sized data, the four failure modes that break every hotel forecast, the vendor pitches worth refusing, and a 90-day plan a single revenue manager can run in-house.
The State of Hotel Demand Forecasting in 2026
Less than ten percent of independent hotels run a dedicated revenue management system in 2026. Skift Research's industry survey put the figure at twenty-eight percent for hotels overall, falling to ten percent once you exclude free tools like Expedia Rev+ and count only properties paying for advanced RMS technology. The remaining bulk runs forecasts in a spreadsheet, in a consultant's deliverable, or not at all.
The European numbers tell the same story with sharper edges. Roland Schegg's 2025 study of 1,500-plus hotels across Austria, France, Germany, Greece, Italy and Switzerland found forty-four percent of properties have a formal revenue management strategy at all. Among that subset, forty-four percent use a dedicated RMS, thirty-three percent still rely on Excel, and twenty percent outsource to external consultants. Seventy-five percent of those hotels run a PMS and sixty-three percent run a channel manager. RMS adoption lags both foundational layers by twenty to thirty percentage points.
What is left on the table is measurable. A Cornell School of Hotel Administration study found hotels that implemented an RMS experienced a four-point-five to seven-point-five percent RevPAR lift. HSMAI's own benchmarking puts the figure at six-point-five percent compared to non-users, with up to fifteen percent for hotels deploying an RMS for the first time. For a fifty-room property running at one-hundred-eighty euros ADR and sixty-five percent occupancy, six percent RevPAR is the difference between roughly 2,013,000 and 2,135,000 euros of room revenue a year, before counting downstream F&B and ancillary lift.
The cost objection has weakened. RoomPriceGenie's entry plans now start at one-hundred-nineteen euros a month. Atomize, Pricepoint, BeonPrice, and several others sit in the same band. The real barriers to adoption have shifted toward operator inertia, fear of automating rate decisions, and a justified suspicion that the vendor demo is not the product. Each of those is real. None of them justifies the gap. This article assumes the operator has decided forecasting matters and now wants the honest read on what to do about it.
What a Hotel Demand Forecast Actually Means
Three operating decisions sit behind a hotel demand forecast and each of them imposes different requirements on the underlying model.
The first is pricing. You forecast unconstrained demand for a future night so you can decide whether to open or close rates, push BAR, drop length-of-stay restrictions, or open negotiated rates to fill. Pricing decisions are sensitive to small changes in expected occupancy at 14, 7, and 3 days out.
The second is inventory. You forecast room-type and segment demand so you can decide whether to oversell, hold rooms for a group block, accept a tour series, or close a channel. Inventory decisions are more sensitive to segment composition than to total volume.
The third is resourcing. You forecast occupancy, arrivals, and departures so the GM can staff housekeeping, the F&B team can order, and the front desk can roster. Resourcing decisions are sensitive to absolute occupancy and arrival counts, not to ADR.
A forecast that gets total occupancy right but the segment mix wrong helps pricing and hurts inventory. A forecast that gets the next 7 days right but the next 90 days wrong helps the GM and hurts the sales team. The first practical conversation you should have inside the hotel is which of these three decisions the forecast is going to optimize, because no single model is best across all three.
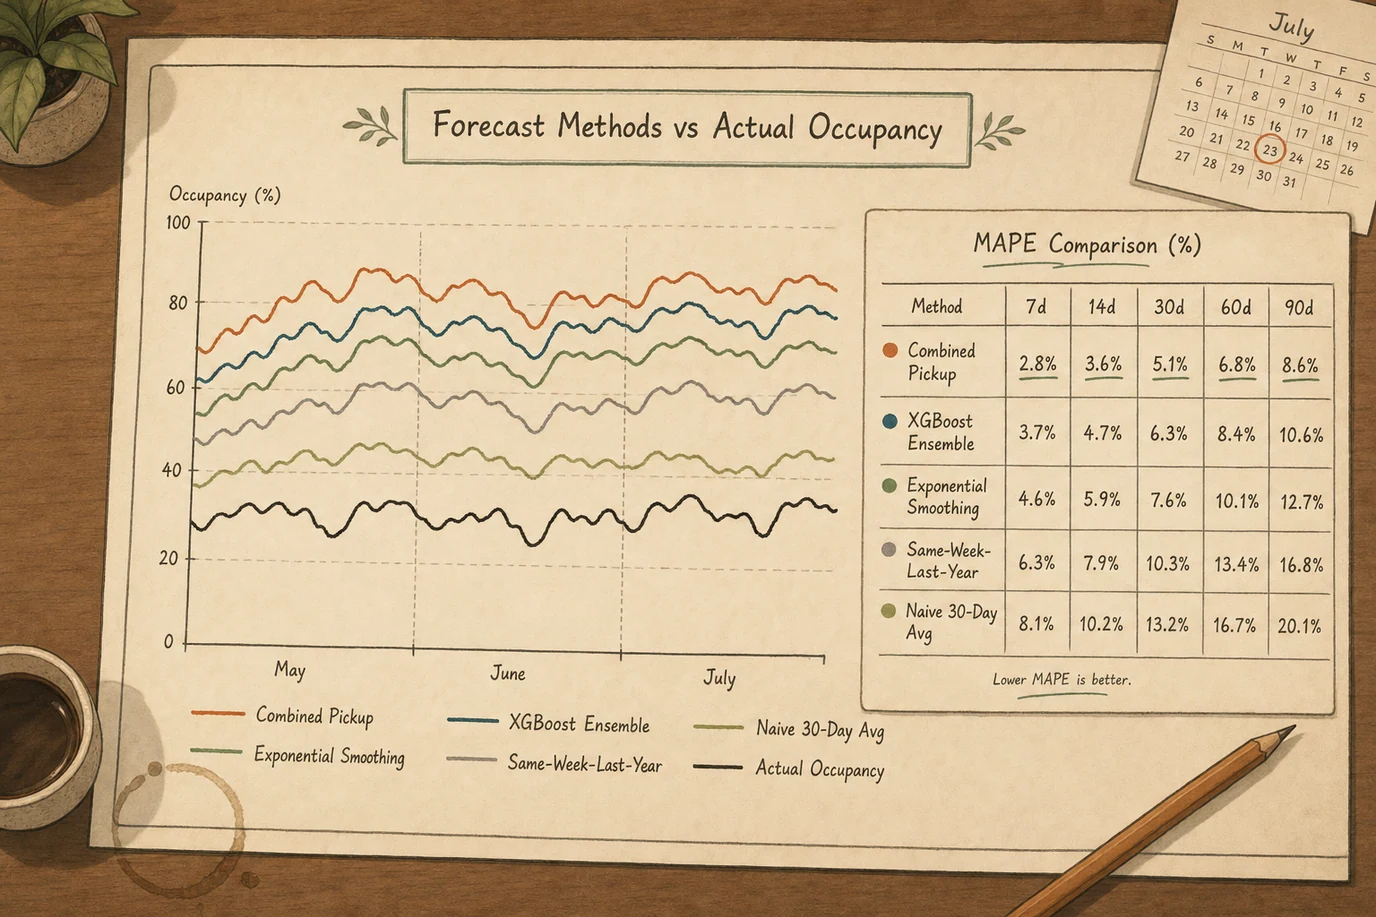
Horizons matter for the same reason. The literature segments hotel demand forecasting into short-term (zero to thirty days), mid-term (thirty to ninety days), and long-term (ninety days to budget). Different methods win at different horizons. The Ampountolas and Legg 2024 paper in the Journal of Revenue and Pricing Management compared four methods across one-to-ninety-day horizons on multiple United States independent hotels and reported that Simple Exponential Smoothing was most accurate in four of the horizons tested, while XGBoost won in seven other cases concentrated at the short end. Same data, different horizons, different winning method. A hotel running one model for everything is leaving accuracy on the table for the horizons that model is not suited to.
The Seven Methods You Will Meet
Seven families of methods cover ninety-five percent of hotel demand forecasting practice in 2026. Each has its own data requirements, strengths, and failure modes. Vendors will sell you one as the best by talking about the others as legacy. The peer-reviewed literature does not support that framing.
1. Pickup Methods (The Workhorse)
Pickup forecasting projects future-night occupancy by reading what you have already booked and extrapolating the remaining unbooked rooms based on historical booking pace. Three variants exist.
Advanced pickup assumes the pickup pattern from on-the-books to stay-night is stable across years. If last year you picked up forty rooms in the final fourteen days for the same week, you assume the same again, adjusting for current on-the-books position. Simple to implement, intuitive to explain, performs poorly when the booking window shifts.
Delta pickup projects the increment from same-time-last-year forward. Less sensitive to absolute volume, more sensitive to year-over-year demand shape.
Combined pickup averages multiple variants, typically with weights derived from rolling backtest accuracy. The combination consistently outperforms the components in published benchmarks. A 2023 paper in the Journal of Revenue and Pricing Management on the additive pickup method with time-series elements specifically targeted SME hotels and found the combined approach better at longer horizons and at low-occupancy periods, where naive pickup tends to be most wrong.
Pickup is the workhorse for a reason. It uses data the hotel already has (on-the-books and history). It works without machine learning expertise. The published research consistently finds it strong for short-to-mid horizons. If you have nothing else, build this first.
2. Time Series (The Academic Baseline)
Time series methods model historical occupancy as a sequence with trend, seasonality, and noise. ARIMA, exponential smoothing, Holt-Winters, and seasonal-naive are the canonical variants.
The Makridakis competitions, which have benchmarked forecasting methods on real data since 1982, find consistently that statistically sophisticated methods do not necessarily produce more accurate forecasts than simple ones, and combinations of methods outperform individual methods on average. The finding holds across decades, across many domains, and across hotels.
For hotels specifically, exponential smoothing in its various forms (simple, Holt, Holt-Winters) is the surprisingly competent default. Ampountolas and Legg found Simple Exponential Smoothing the most accurate single method across multiple horizons in their 2024 study. That is the kind of finding revenue technology vendors do not put on the front of the brochure.
Time series methods need clean history and dislike structural shocks. The 2020 to 2022 period contaminated the historical data for most hotels. The 2023 SME paper explicitly addresses how to handle this: drop the years entirely, use a structural-break dummy, or extend the additive pickup with a time-series component that is more robust to recent shocks. None of the answers are trivial.
3. Regression and Multivariate
Regression models predict demand as a function of named drivers: day-of-week, lead-time, season, event indicator, weather, competitor rate, OTA promotion flag, school holiday indicator. The named-driver approach has the major operating advantage that you can read the model and decide whether the coefficients make sense.
The disadvantage is that you have to choose the drivers. The model is no better than the feature engineering. Most published hotel regression work is from 2010 to 2020 and the 2024 to 2026 literature has largely moved on. The technique remains practical for hotels with a strong local-event calendar where the events matter more than seasonality, but it is rarely the recommended starting point for a new forecasting practice in 2026.
4. Machine Learning Ensembles (The Workhorse with a Degree)
Gradient boosting (XGBoost, LightGBM, CatBoost), random forests, and ensemble methods now dominate the practical machine learning literature for hotel forecasting.
A 2022 paper in Current Issues in Tourism compared twenty-two methods and found machine learning approaches reduced root mean squared error by up to fifty-four percent for 1-day forecasts and forty-five percent for 14-day forecasts compared to traditional exponential smoothing. A 2025 Springer paper in the Journal of Revenue and Pricing Management compared Gradient Boosting Regression with Support Vector Regression and reported normalized RMSE of 0.044 versus 0.055, a narrow but consistent lead for GBR. A 2024 Korea Science paper combined XGBoost with DTW K-means clustering to improve accuracy further by selectively combining a global model with property-cluster-specific local models.
The honest read on the ensemble literature is consistent and unflattering to deep learning: gradient boosting on engineered features beats more complex methods on hotel-sized datasets in most published benchmarks. The data is too small for deep networks to learn the patterns the simpler methods are already capturing.
5. Deep Learning (The Headline That Under-Delivers on Hotel Data)
LSTMs, Transformers, and other deep architectures excel on large, complex time-series datasets. Hotels are neither large nor in the volume sense that deep learning prefers. A 200-room hotel with five years of history has fewer than 400,000 room-nights of training data. That is on the small side for deep methods.
A 2024 ensemble study reported Bidirectional LSTM architectures with negative R-squared scores on hotel data, indicating the model could not capture seasonal patterns and was overfitting. The same study found a Prophet plus LightGBM plus Ridge regression ensemble outperformed the LSTM by 10.2 percent. This is the typical pattern for hotel-sized data: well-tuned ensembles beat well-tuned deep networks.
Deep learning becomes competitive on hotel data when you have either many properties (a portfolio of fifty-plus hotels training one model with property embeddings) or many adjacent signals (OTA pricing, web traffic, search volume, weather) that the deep network can fuse. Single-property forecasting with three years of history is not the regime where the architecture pays for its complexity.
6. Foundation Models (The Speculative Front)
TimeGPT, Chronos, Lag-Llama, Moirai, and the next wave of time-series foundation models trained on diverse corpora are real and worth knowing about. Chronos, an Amazon research model released in 2024, tokenizes time series values and applies T5-family transformers to produce probabilistic forecasts in a zero-shot mode. Published benchmarks on forty-two datasets show Chronos outperforms specialized methods on datasets it has seen during training and produces comparable or occasionally superior zero-shot performance on new datasets. Chronos-2, released in 2025, extends this lead.
The honest framing for a hotelier in 2026: there is no published peer-reviewed comparison of Chronos or TimeGPT against tuned XGBoost on hotel demand data. The benchmarks that exist are on retail, energy, weather, and generic time series. Several vendors have started incorporating foundation models into their forecasting stacks. None has yet published independent accuracy benchmarks for hotel data. The position is plausible but unproven.
Revisit this in 24 to 36 months. The technology is moving fast, the academic literature is catching up, and the answer in 2028 may be different from the answer in 2026. As of today, betting your revenue management budget on a foundation-model-first vendor is buying a thesis, not a result.
7. Naive Baselines (The Surprisingly Competitive Control)
Same-week-last-year. Rolling-thirty-day average. Last-year occupancy times current pace ratio. These methods are what every hotel forecast must beat to justify any complexity.
The published research is consistent that naive methods are harder to beat than you expect, particularly for hotels with stable seasonality and limited event variability. A 1.5 to 3 percent MAPE improvement over a naive baseline is what a mid-quality professional forecast looks like in published benchmarks. A 10 to 15 percent improvement is what a high-quality forecast on data with strong leading indicators looks like. Anyone promising 30 to 50 percent improvement without showing you the baseline they beat is misrepresenting the math.
The discipline of running a naive baseline alongside the real forecast is the cheapest single accuracy tool a revenue manager has. If your four-hundred-euro-a-month vendor cannot consistently beat same-week-last-year by 5 percent on your data, you are paying 4,800 euros a year for a coloured chart.
The methods comparisons that matter most for an independent hotel converge on the same answers: pickup is the workhorse, exponential smoothing is the surprisingly competent default, gradient boosting ensembles win at the short horizon when properly tuned, and combinations of methods outperform single methods on average. Deep learning under-delivers on single-property hotel data. Foundation models are speculatively interesting and pragmatically unproven. Naive baselines are the floor every forecast must clear, period.
The Four Things That Break Every Hotel Forecast
Methods are debated in journals. Failure modes are universal. Four specific problems blow up nearly every hotel forecast in our auditing experience, and the published research backs each one.
1. Group Blocks
Group business is the single largest distortion in independent hotel forecasting. The published group-forecasting research is older but the dynamics have not changed. Lee's 1999 paper in the Journal of the Operational Research Society remains the canonical study and reported mean absolute percentage errors of forty percent at two months before arrival, thirty percent at one month before arrival, and ten-to-fifteen percent on arrival day, with positive bias across all time horizons. Positive bias means the forecast over-states group demand, which means the hotel holds rooms it does not need, which means the transient business that would have filled them was turned away or sent to a competitor.
Group wash is the specific term. The wash factor is the percentage of reserved rooms in a group block that will not pick up, due to cancellations, no-shows, or downsized rooming lists. Hotels that do not track wash by group type (corporate, leisure, wedding, sports, association) will systematically over-forecast.
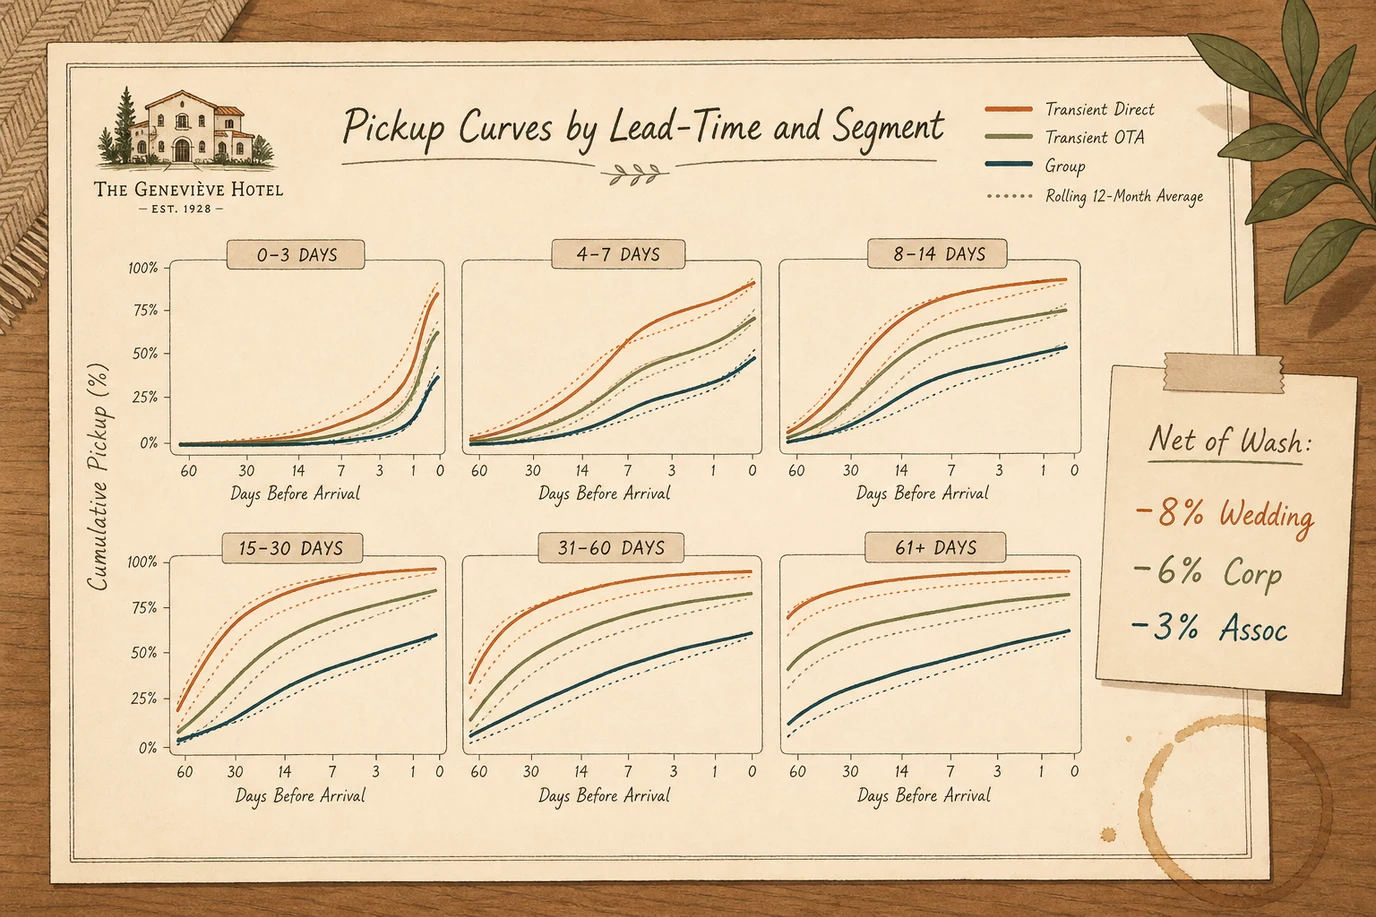
The practical fix is rolling twelve-month wash tracking by group segment, with forecast adjustment to net of wash, not gross. The wash factor for wedding groups in our European auditing experience runs at eight to twelve percent. Corporate groups run closer to four to eight percent. Highly contracted association groups can run as low as two to four percent. A property running one universal wash assumption will be wrong twelve months a year for at least one segment.
2. Cancellation Contamination
Cancellation rates have stayed elevated above pre-pandemic norms and the channel mix matters. D-EDGE's 2024 Hotel Distribution Report found cancellation rates back near 2019 levels but still high. SiteMinder's analysis of 125 million reservations in 2024 reported global cancellation rates below twenty percent and an average booking window of thirty-two days. The channel split inside that aggregate is wide: direct bookings cancel around eighteen percent, OTA bookings cancel at forty to fifty percent, with Booking.com specifically running over forty percent revenue cancellation in some D-EDGE samples.
Forecasts that treat gross bookings as the demand signal will overestimate by the cancellation rate. Forecasts that treat all channels as one block will overestimate when the OTA mix rises. The practical fix is two-fold: separate gross and net pickup curves in the forecasting model, and segment by channel so the cancellation propensity travels with the segment.
A specific failure pattern: a hotel shifts the channel mix from sixty percent direct to forty percent direct over twelve months. The cancellation propensity rises mechanically because the OTA mix has grown. The forecast, trained on the old channel composition, overstates net demand and the hotel either holds rooms it should release or prices ahead of the curve and loses share. We see this exact pattern often enough that it is worth a named diagnostic: the channel-mix forecast drift.
3. Lead-Time Shifts
The booking window distribution has shortened post-pandemic and is still moving. SiteMinder's 2024 data put the global average booking window at thirty-two days, up from a 2023 low and down significantly from pre-2020 norms. The drift inside the average is the interesting part: short-lead bookings (zero-to-seven days) have grown disproportionately, particularly for leisure transient.
Pickup models calibrated on a stable booking window break when the window shifts. The on-the-books position at thirty days out is now a worse predictor of stay-night occupancy than it was in 2019, because the share of demand that books inside thirty days has grown. A forecast that does not re-calibrate the pickup curve at least quarterly will systematically under-forecast demand and over-forecast the share already on the books.
The practical fix is quarterly recalibration of the pickup curve, with separate curves by segment if the segment-level mix is material.
4. Calendar Misalignment
The fourth failure is the most preventable and the most embarrassing. Events, holidays, school terms, religious observances, and one-off market events (a conference, a sports series, a flight schedule change) are the largest drivers of week-on-week demand variation. A forecast model that does not have these encoded as features will systematically miss the spikes.
Our auditing finding is that the typical independent hotel runs three or four named events in its forecast spreadsheet and is unaware of another fifteen to twenty events the model should have picked up. We have seen hotels miss the local marathon weekend because the event was in a sales database but not in the forecasting spreadsheet, with predictable five-figure-euro losses on a single weekend.
The practical fix is one calendar of record. One canonical source where events, public holidays, school terms, supplier events, and one-off market shifts are entered and dated. The forecast model then reads from it. Most modern PMS and RMS products offer an integrated events calendar. If yours does not, the cheapest single revenue intervention you can run this quarter is building a shared spreadsheet and giving the reservations team a standing weekly fifteen-minute review.
What Actually Moves the Needle for an Independent Hotel
The four failure modes above are universal. The fixes that actually improve forecast accuracy on an independent hotel are surprisingly consistent across our auditing engagements. In order of effort:
1. Clean the Cancellation Data
This is the foundation. Every other improvement builds on it. The cancellation flag in your PMS needs to reliably separate cancelled bookings, no-shows, and modifications. The cancellation-reason field needs to be enabled and populated for every cancellation. OTA-attributed cancellations need to be tagged distinctly from direct cancellations. Most independent PMS deployments have at least one of these three configured wrong. We audit twelve to fifteen hotels a quarter and at least eight typically need this fix before any forecasting work is worth doing.
Cost: zero, this is a configuration job. Time: two to five days of work with the PMS vendor's support. Impact: every downstream metric becomes trustworthy.
2. Track Pickup by Lead-Time Bucket and Segment
Most pickup curves are reported as one number, for example we pick up sixty rooms in the final fourteen days for a typical Friday in July. The number is an average across segments and lead-times. The signal it loses is more useful than the number it provides.
The bucket structure that actually works for an independent hotel is six lead-time buckets (zero-to-three days, four-to-seven days, eight-to-fourteen days, fifteen-to-thirty days, thirty-one-to-sixty days, sixty-one-plus days) and three segments at minimum (transient direct, transient OTA, group). Eighteen pickup curves to track, not one. A spreadsheet with a weekly cell update for each is enough. The granularity reveals where the forecast is breaking, which is information you cannot derive from a single average pickup number.
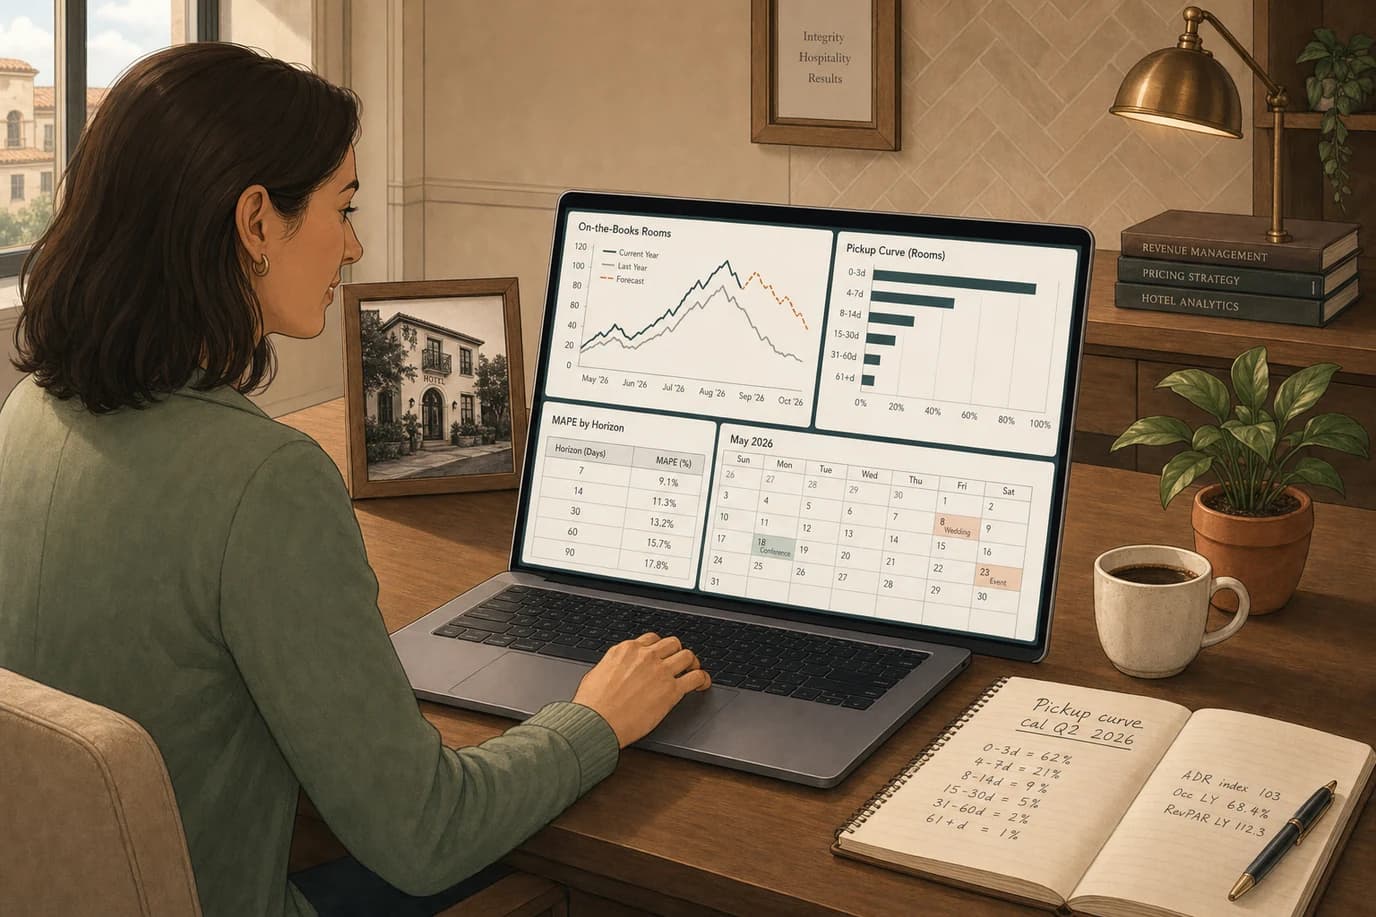
3. Build a 7/14/30/60/90 Day MAPE Scoreboard
Whichever method you forecast with, you should know the historical accuracy at each horizon. The MAPE scoreboard is a spreadsheet that compares forecast versus actual for the last twelve months at five horizons (7-day, 14-day, 30-day, 60-day, 90-day) at the total occupancy level. Each week you re-forecast, you add a row.
The discipline is to refuse to use a forecast in any commercial decision until you have run twelve weeks of scoreboard data. The scoreboard answers the question how good is my forecast with a number instead of a feeling. Most independent hotels we audit have never produced this number. The hotels that do produce it improve their forecasting accuracy by ten to twenty percent over six months purely from the operating awareness of where the model breaks.
A reasonable MAPE benchmark for a mid-quality forecast on a 50-to-200-room independent hotel: eight percent at 7 days, eleven percent at 14 days, fifteen percent at 30 days, twenty-two percent at 60 days, twenty-eight percent at 90 days. If your numbers are within those bands, you have a healthy forecast. If you are double those numbers at the same horizons, something specific is broken and the scoreboard will tell you where.
4. Calibrate Group Wash
The default assumption in most independent hotels is that a confirmed group block will materialize at one-hundred percent of the rooming list. The data does not support that and the published research (Lee 1999, the Duetto group-wash whitepapers, the 2024 to 2025 Hospitality Net opinion pieces) is clear about it.
The practical fix is a rolling twelve-month wash calculation by group segment, refreshed quarterly, and applied to the gross block as the forecast input. Six to twelve percent wash for wedding groups. Four to eight percent for corporate. Two to four percent for highly-contracted association groups. Your own data will refine these bands. The mechanical fact is that running gross-of-wash is the largest single forecasting error in most independent hotel revenue management practice.
5. Re-Forecast Cadence
Daily re-forecast for the next 14 days. Weekly re-forecast for the next 30 to 90 days. Monthly re-forecast for the next 90 to 365 days. The cadence is not about needing to look at the forecast that often, it is about catching shifts early enough to act on them.
A revenue manager who re-forecasts the 90-day horizon monthly will catch a channel-mix drift at month four. A revenue manager who re-forecasts the 90-day horizon weekly catches it at week five. The forecast accuracy is identical, the decision speed differs by twelve weeks. Twelve weeks of cumulative revenue impact at a five-percent ADR delta on a 50-room hotel is a five-figure euro number, every quarter.
Most independent properties run a monthly forecast meeting because that is the historical cadence inherited from owner reporting cycles. The practical recommendation is to keep the monthly meeting for the budget conversation and add a fifteen-minute Tuesday morning forecast review for the actionable horizons. Operating cost: fifteen minutes a week. Operating benefit: every forecasting drift gets caught at week four instead of month four.
The Vendor Landscape (Who Actually Does What)
The 2025 HotelTech Awards ranked Duetto first, RoomPriceGenie second, and Atomize third among sixty-five revenue management solutions surveyed, with IDeaS positioned as the enterprise runner-up. The market has consolidated around enterprise, mid-market, and SMB price points and the choice for an independent hotel is more about price band and operating model than about underlying forecast accuracy.
Enterprise (Duetto, IDeaS)
Duetto's GameChanger and IDeaS G3 are the dominant enterprise products. Both are mature, both have strong group evaluation modules, both integrate with the major PMS systems, and both price into the four-figures-per-month range for a single property. IDeaS uses SAS-derived analytics with a longer history. Duetto's positioning emphasizes open pricing across segments and channels. For an independent hotel with fewer than 200 rooms, both are over-tooled and over-priced relative to the operating value they deliver, which is not a criticism of the products but an honest read on the fit.
SMB (RoomPriceGenie, Atomize, Pricepoint, BeonPrice)
The mid-market and SMB segment is where the choice gets interesting for an independent hotel. RoomPriceGenie, Atomize, Pricepoint, and BeonPrice all sit in the one-hundred-to-five-hundred euros per month band and all use machine-learning-driven pricing with embedded demand forecasts. The operating differences are practical: RoomPriceGenie automates the most (price changes pushed without intervention by default), Atomize requires more user oversight, Pricepoint has a strong European market focus, BeonPrice's heritage is in the Spanish and LATAM markets.
The forecast accuracy of these vendors is rarely independently benchmarked. None has published peer-reviewed MAPE numbers for their own forecast. The vendor demo will show you the dashboard. The data on whether the dashboard is better than your spreadsheet will come from running the vendor's forecast alongside yours for sixty days and comparing both to actuals. Insist on that test before signing a multi-year contract.
Native PMS Forecast Modules (Cloudbeds Insights, Mews Demand Forecast)
Cloudbeds Insights and Mews have shipped native forecast modules in 2024 and 2025 that aim to deliver a serviceable forecast inside the PMS for properties that do not want to add a dedicated RMS. The honest framing on these is that they are reasonable for a hotel below thirty rooms that needs better than a spreadsheet, and below the accuracy of a tuned ensemble model or a dedicated RMS for properties above 100 rooms with complex group business. Use them as a baseline, not as a justification to avoid a dedicated RMS at scale.
The AI Forecasting Marketing Claim
Almost every RMS vendor now markets AI-powered forecasting. Open the technical documentation, and the underlying engine is almost always gradient boosting (XGBoost or LightGBM most commonly) with a feature-engineering layer for events, lead-time, and channel. That is a respectable engineering choice and what the peer-reviewed literature says works for hotel-sized data. The AI branding is largely accurate as a label and largely inflated as a differentiation, because every serious vendor in this segment is using the same family of models.
If a vendor pitches proprietary AI without being willing to disclose the model family, the feature set, or the backtest methodology, you are buying marketing. The honest question to ask in a vendor selection call: what model family do you use, what features do you engineer, what is your reported MAPE at 7, 14, and 30 days on a typical 100-room independent hotel, and can you share the methodology of how that MAPE is measured. A vendor unwilling to answer those four questions is selling you a black box, and a black box in revenue management is a black box in the most consequential decisions the hotel makes every day.
A 90-Day In-House Plan
The plan below assumes one revenue manager (or owner) with access to the PMS, a spreadsheet, and roughly an hour a day. Cash cost: under 200 euros total for optional tooling. Outcome: a functioning forecasting practice that beats the same-week-last-year baseline by ten to twenty percent and provides the basis for any subsequent vendor evaluation.
Days 1 to 14. Clean the data foundation. Audit the PMS configuration for cancellation reasons, no-show flags, channel attribution, and segment codes. Fix any field that is missing or misconfigured. Pull twenty-four months of historical occupancy and ADR by date, by segment, and by channel into a single spreadsheet. Identify and tag the COVID period (March 2020 through December 2022) as a structural break. Decide whether to exclude or include it (the 2023 SME paper suggests including it as a labelled break for short-history hotels). The deliverable is one clean dataset with no missing dates and no unresolved cancellation status.
Days 15 to 30. Build the MAPE scoreboard. In the spreadsheet, run a same-week-last-year naive forecast for the last twelve months at each horizon (7, 14, 30, 60, 90 days). Compute MAPE for each. This is your baseline. Every method you try going forward gets compared to this. Add a second tab for actual versus forecast tracking. From this week forward, log the forecast at each horizon and the actual when it happens.
Days 31 to 45. Build the pickup curves. Calculate the pickup curve at each of the six lead-time buckets and three segments. The output is eighteen curves showing average daily pickup by remaining lead-time. Save them as a separate reference tab. The first time you build them, the data will surprise you. Most independent hotels have a clear seasonality pattern in the lead-time curve that they have never explicitly visualised.
Days 46 to 60. Build the combined pickup forecast. Use the pickup curves and current on-the-books position to produce a forward forecast at each of the five horizons. Run this forecast in parallel with the naive baseline and the same-week-last-year forecast every Tuesday morning. Log both in the scoreboard. After four weeks, compute the lift of the combined pickup forecast over the naive baseline at each horizon.
Days 61 to 75. Add group wash and segment. Calculate the rolling twelve-month group wash factor by segment (wedding, corporate, association, leisure, tour). Apply the wash factor to gross group bookings in the forecast as a net-of-wash adjustment. Track the same forecast lift over the previous version on the scoreboard. The wash adjustment alone typically improves the forecast by three to five percent MAPE at the 30-to-60 day horizon for properties with material group business.
Days 76 to 90. Decide on the vendor question. By day 90 you have a working in-house forecasting practice with documented accuracy. Now you can make an evidence-based vendor decision. Bring two RMS vendors in for a 60-day side-by-side test. Each vendor delivers a forecast at each of the five horizons every Tuesday morning. Log their forecasts in the scoreboard. After 60 days, compare each vendor's MAPE to your in-house forecast at each horizon. The decision becomes easy. If the vendor consistently beats your in-house number by enough to justify the monthly fee, sign. If not, keep the in-house process and consider revisiting in twelve months.
This is the inverse of the typical vendor selection. Most independent hotels evaluate a vendor in a demo against an imagined baseline. The recommendation is to evaluate a vendor in a side-by-side against a measured baseline. The data will tell you whether to spend.
How Prostay Handles Demand Forecasting
The Prostay PMS ships a native forecast module that targets the practical operating gap for an independent hotel below 150 rooms. The model under the hood is a combined pickup engine with a configurable time-series overlay (default exponential smoothing) and the option to add gradient-boosting-based residual correction once the property has six months of clean data in the system.
The cancellation and channel attribution fields are pre-configured to support the forecast natively, so the data foundation work described above is in place from day one rather than requiring a custom data audit. The wash factor module calculates rolling twelve-month wash by group segment automatically once the segment codes are populated. The MAPE scoreboard runs as a continuous dashboard rather than a manual spreadsheet, with weekly auto-calculated lift versus the same-week-last-year baseline.
The 7/14/30/60/90 day horizons are pre-computed daily and surfaced in the revenue dashboard. The pickup curves are visualised for each segment and lead-time bucket without manual spreadsheet work. The event calendar is one source of record across reservations, sales, and the forecast model, removing the calendar misalignment failure mode by construction.
For independent properties that prefer a dedicated RMS, Prostay integrates natively with RoomPriceGenie, Atomize, and Duetto through the standard channel manager, which means the forecast data and pickup curves are exposed to the RMS without a separate integration project. The native forecast is positioned as the baseline rather than the replacement. Every property has a forecast on day one, and the decision to add a dedicated RMS becomes the side-by-side evaluation described in the 90-day plan.
None of which is to say Prostay is the only way to do this. A revenue manager running any modern PMS can execute the in-house plan with effort. The practical observation is that the data foundation, pickup curve calculation, wash tracking, and MAPE scoreboard add up to roughly four to six weeks of focused work per property per year if done manually. A platform that ships them by default removes the operating tax, so the revenue manager can spend the time on actually using the forecast rather than producing it.
Key Takeaways
Forecasting is the oldest discipline in hotel revenue management and the most under-instrumented in practice. Less than ten percent of independent hotels run a dedicated RMS. Cornell and HSMAI benchmarks suggest four-point-five to fifteen percent RevPAR lift is on the table for properties that do not yet forecast systematically.
The honest read on methods is that combined pickup is the workhorse, exponential smoothing is the surprisingly competent default, gradient boosting ensembles win at the short horizon when properly tuned, naive baselines are harder to beat than vendors will admit, and combinations of methods consistently outperform single methods. Deep learning under-delivers on single-property hotel data. Foundation models are speculatively interesting and pragmatically unproven on hotel data as of 2026.
The four failure modes that break every hotel forecast are group blocks (Lee 1999 MAPE forty percent at two months), cancellation contamination (OTA forty to fifty percent versus direct around eighteen percent per SiteMinder and D-EDGE 2024), lead-time shifts (SiteMinder 2024 average booking window thirty-two days and shortening), and calendar misalignment. The fixes are: clean the cancellation data, track pickup by lead-time bucket and segment, build a 7/14/30/60/90 day MAPE scoreboard, calibrate group wash, and re-forecast at the cadence the decision actually needs.
The vendor landscape is consolidating around Duetto and IDeaS at enterprise, RoomPriceGenie and Atomize and Pricepoint and BeonPrice at SMB, with native PMS forecasts (Cloudbeds Insights, Mews demand forecast) filling the budget end. Almost every vendor's AI claim is gradient boosting under the hood, which is the correct engineering choice and a misleading differentiator. Ask any vendor the four questions in the vendor section before signing.
The 90-day in-house plan is the recommended starting point. Cash cost under 200 euros, time cost one hour a day, outcome a measured baseline that turns the vendor decision from a marketing call into a data call. Prostay ships the native forecast and the data foundation by default, which removes the operating tax of building it manually and frees the revenue manager to actually use the forecast rather than produce it. A live demo is the fastest way to see whether that baseline matches how you actually want to operate.