What is RevPAR in Hotel: Revenue Per Available Room Explained
Oct 17, 2025
 Mika Takahashi
Popular Categories
Hotel Technology & InnovationHotel Operations OptimizationDigital MarketingIndustry TrendsRevenue ManagementHospitality Industry
Popular Categories
Trending Post

Hotel Walk Letter Template: Professional Guest Communication

Online Travel Agents: What They Are and How They Work

Hotel Security Systems: Modern Protection Solutions

Hotel Advertising: Complete Guide to Boost Bookings and Revenue

25 Hotel Marketing Strategy Ideas for 2025: Complete Guide

AI Reservation Agent: Revolutionizing Hotel Booking and Guest Experience

PMS Communication: Streamlining Property Management Through Effective Guest Messaging
Table of contents
Revenue per available room, or RevPAR as it’s commonly called, is one of the most important key performance indicators in the hotel world. This metric gives hotel managers a clear picture of how well their property is turning its total room inventory into revenue, going beyond just looking at occupancy rates or average room prices.
For anyone working in the hospitality industry, getting a solid grasp on how to calculate and interpret RevPAR is crucial for a winning revenue management strategy. Whether you’re running a luxury property, analyzing your market segment, or setting pricing strategies, knowing what RevPAR measures—and how to boost it—can make a big difference in your hotel’s bottom line.
In this article, we’ll walk you through everything about RevPAR, from the basics of calculation to advanced benchmarking techniques that can help you maximize your hotel revenue and stay ahead of the competition.
What is RevPAR in Hotels
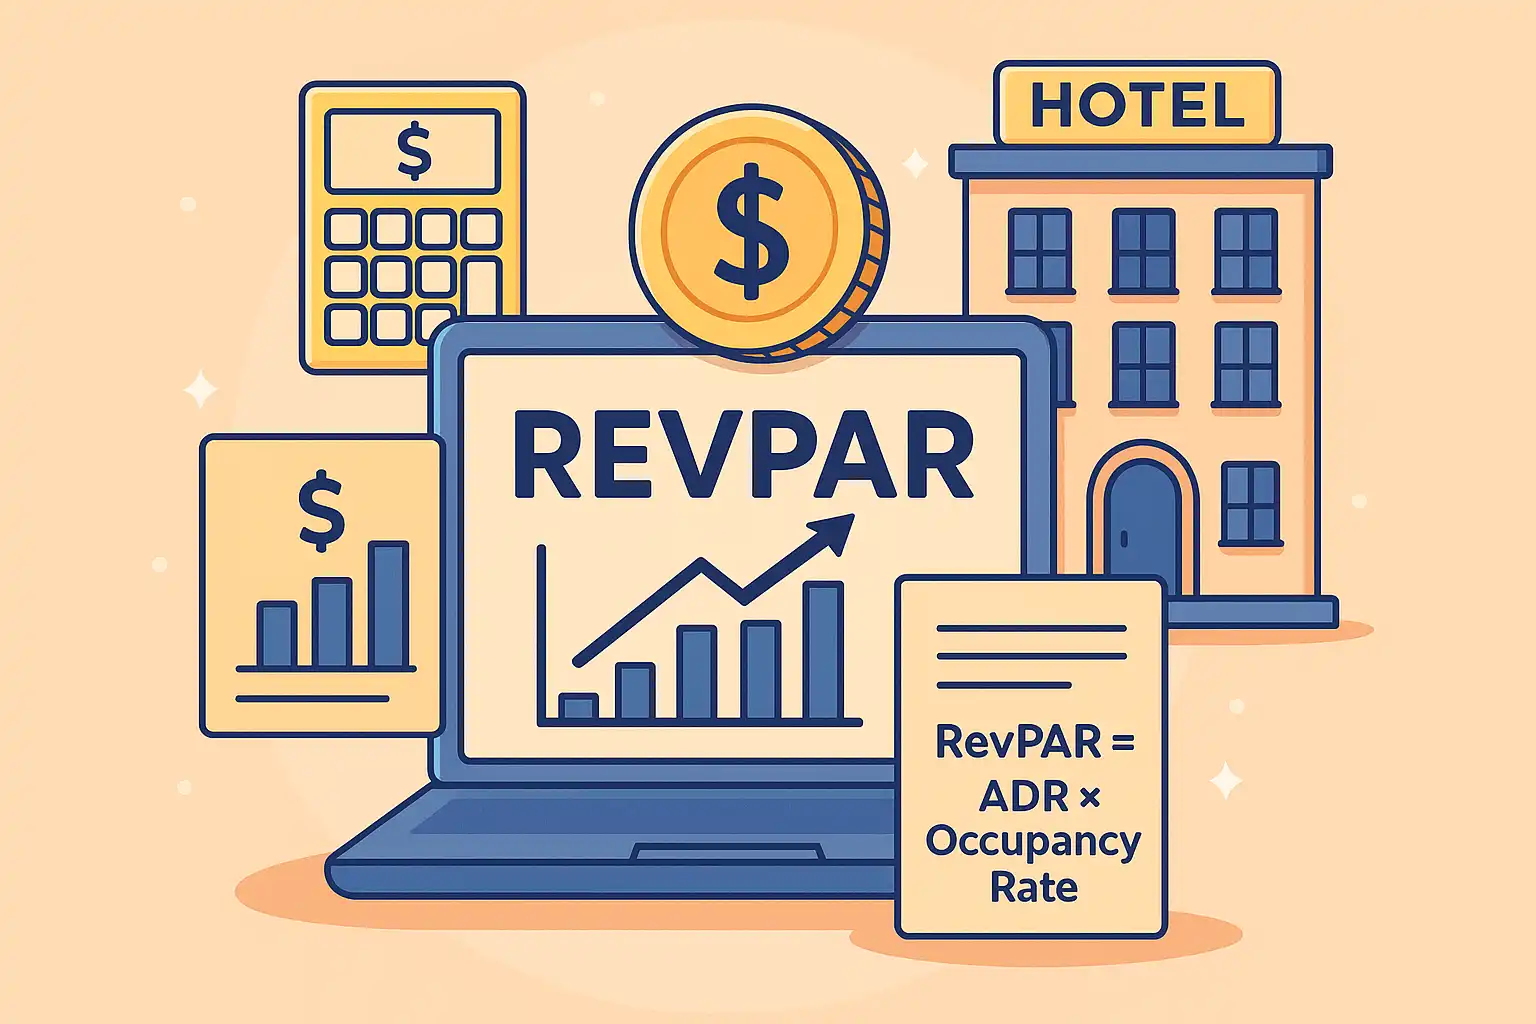
RevPAR stands for revenue per available room, and it’s a key metric that measures the total revenue generated from every available room in your hotel’s inventory. Unlike other metrics that only focus on rooms that are occupied, RevPAR takes all available rooms into account, giving you a full picture of how well your hotel fills rooms and brings in revenue.
This metric combines occupancy rates and average room rates to reveal your overall revenue performance. While the average daily rate (ADR) tells you how much you earn from each occupied room, RevPAR shows how much revenue your hotel’s ability to fill rooms generates across your entire inventory.
RevPAR is different from ADR because it factors in unoccupied rooms, making it a more accurate reflection of your overall revenue generation. It captures both your pricing strategy and your hotel’s ability to maintain strong occupancy levels.
To better understand what is revpar in hotel, revpar is expressed as a dollar amount—say, $85 RevPAR—it can be calculated for any given period, whether daily, monthly, or yearly. This flexibility lets hotel managers track trends over time and compare their property’s RevPAR with industry benchmarks and other hotels.
As a critical tool in revenue management, RevPAR helps you assess your hotel’s performance and pinpoint areas where you can improve. By understanding how to calculate RevPAR, you can make smarter decisions about pricing, market segmentation, and operational changes that directly boost your revenue.
How to Calculate RevPAR: Formulas and Examples
There are two main ways to calculate RevPAR, and both give you the same result—so you can choose whichever fits your data best. The first method divides total room revenue by total available rooms, while the second multiplies average daily rate by occupancy rate.
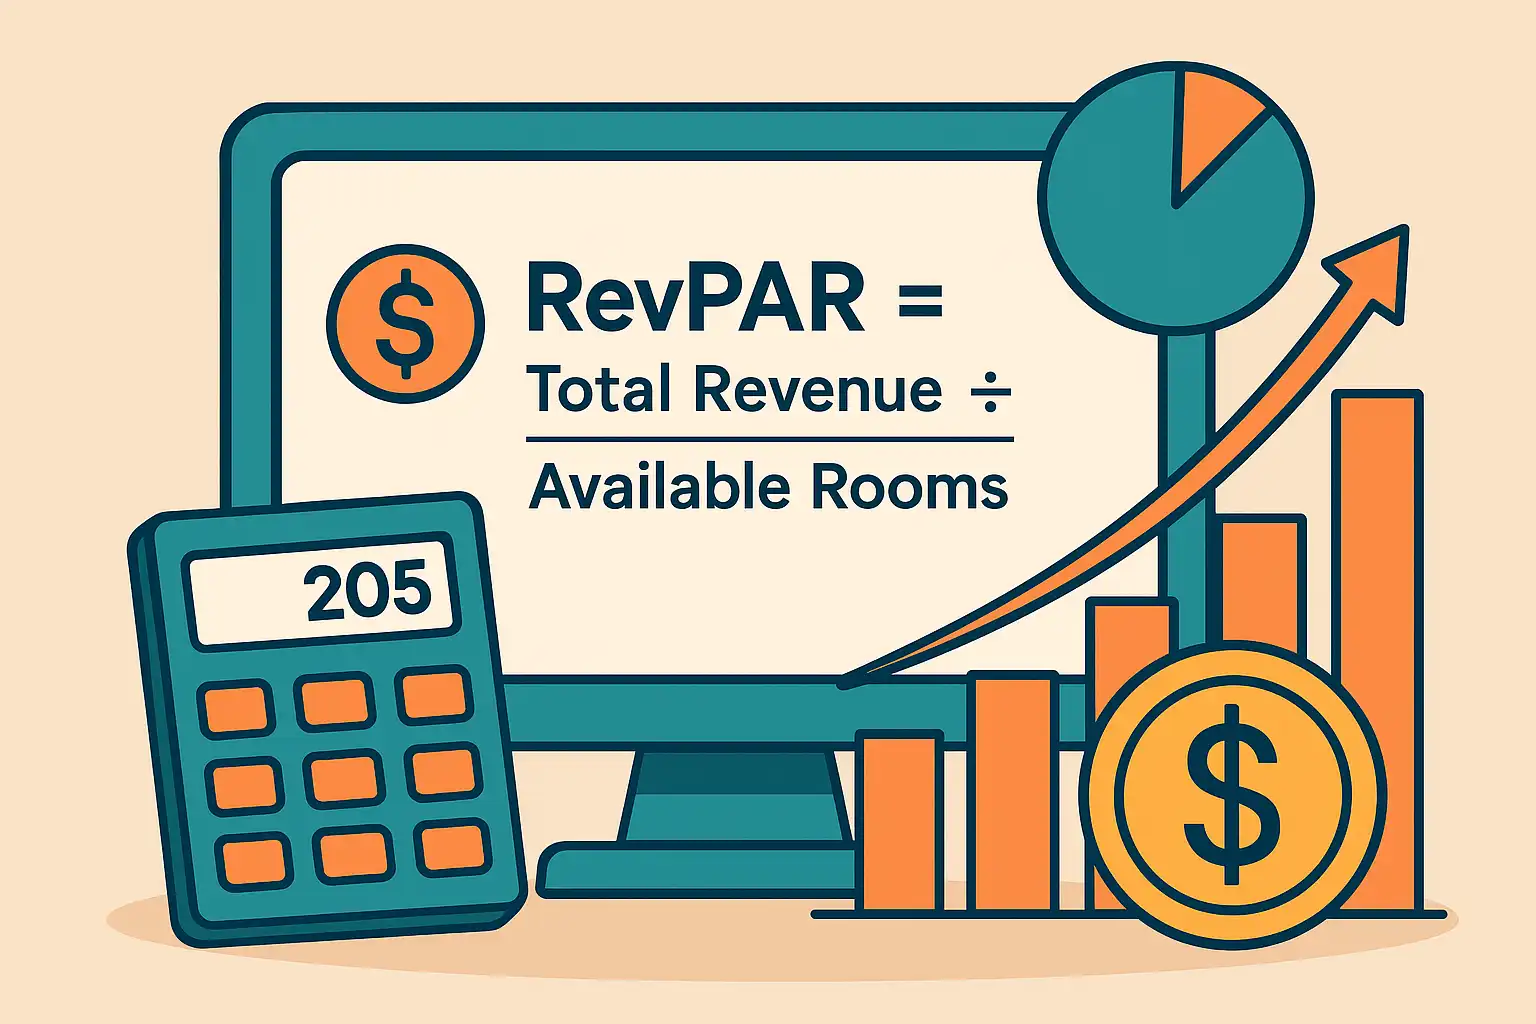
The primary formula is: RevPAR = Total Room Revenue ÷ Total Available Rooms
This straightforward method measures the revenue generated per room by dividing your total room revenue by your hotel’s total room inventory. For example, if your hotel makes $15,000 in room revenue in one day and has 150 rooms available, your RevPAR is $100.
The alternative formula is: RevPAR = Average Daily Rate (ADR) × Occupancy Rate
Here, you multiply your average room rate by your occupancy percentage. So if your ADR is $125 and your occupancy is 80%, your RevPAR is $125 × 0.80 = $100.
To calculate annual RevPAR, multiply your total available rooms by 365 days to get the total available room nights for the year. This helps you analyze long-term trends and seasonal impacts on your revenue.
RevPAR Calculation Examples
Let’s look at some real-world examples to see how RevPAR works in different situations:
Hotel A: A 150-room hotel generates $15,000 in daily room revenue. Using the first formula: $15,000 ÷ 150 = $100 RevPAR. This shows solid revenue across all available rooms.
Hotel B: A 200-room property operates at 75% occupancy with a $140 ADR. Calculating RevPAR: $140 × 0.75 = $105. This hotel has good pricing but could boost occupancy.
Hotel C: A 50-room boutique hotel has 90% occupancy and an $80 ADR. RevPAR is $80 × 0.90 = $72. Here, high occupancy makes up for lower rates.
Monthly RevPAR: To find monthly performance, multiply daily RevPAR by the number of days in the month. For example, if daily RevPAR is $95 in February (28 days), multiply $95 × 28 × total rooms to get monthly revenue.
These examples show how different combinations of occupancy and rates affect RevPAR, helping you understand the balance between pricing and filling rooms.

Why RevPAR Matters for Hotel Revenue Management
What is RevPAR in hotel? RevPAR gives you a comprehensive snapshot by combining pricing and occupancy in one metric. This helps you figure out if low revenue is due to low occupancy, low rates, or both.
Knowing your property’s RevPAR also helps forecast profitability and guides pricing decisions across different demand patterns. Revenue managers use it to optimize inventory and maximize revenue during both busy and slow times.
Benchmarking your RevPAR against other hotels reveals where you stand in your market and highlights areas where you can improve through pricing or marketing changes.
RevPAR trends often reflect broader market conditions and seasonality, letting you anticipate shifts and tweak your strategy to stay competitive.
It’s also a useful tool to identify operational improvements that can boost revenue, whether that’s encouraging direct bookings, cutting cancellations, or enhancing room service.
Tracking changes in RevPAR can signal when it’s time to adjust promotional packages or loyalty programs, making it a key performance indicator for ongoing management.
RevPAR Index and Benchmarking
The RevPAR Index, or revenue generating index (RGI), compares your hotel’s RevPAR against a group of similar properties in your market. This benchmarking helps you see if you’re keeping pace with competitors or falling behind.
The formula is: (Your Hotel RevPAR ÷ Competitive Set RevPAR) × 100
An index of 100 means you’re on par with competitors. Scores above 100 show you’re outperforming them. For example, if your RevPAR is $85 and the market average is $75, your index is (85 ÷ 75) × 100 = 113, indicating strong performance.
This metric shows how well your property captures its expected market share compared to other hotels. A high index means your revenue management is working well; a declining index suggests you may need to rethink your strategy.
You can also track RevPAR percentage change year-over-year: (Current Year RevPAR ÷ Previous Year RevPAR) - 1. This helps you see if your revenue generation is improving over time, even if the market is tough.
What is a Good RevPAR
What counts as a “good” RevPAR varies widely depending on property type, location, and market. Luxury hotels in major US cities often aim for RevPAR above $300, while upper upscale hotels target $180-250.
Mid-scale hotels in the US generally look for $90-120, though this depends on local market conditions. Secondary markets may have lower absolute numbers but can still perform strongly if they beat their competition.
In Europe, luxury properties often target over €250, with mid-range hotels aiming for €100-180 depending on the market.
Instead of focusing only on raw numbers, it’s smarter to evaluate your RevPAR relative to your competitive set and past performance. A good RevPAR is one that grows steadily and outperforms similar hotels.
Seasonality also plays a big role. During high demand periods, luxury hotels might see RevPAR well above $400, while in slower seasons, $200-250 might be a healthy target.
How to Improve Your Hotel’s RevPAR
Boosting your hotel’s RevPAR means smartly balancing occupancy and average rates. The best strategies focus on increasing RevPAR through dynamic pricing, encouraging direct bookings, and diversifying revenue streams.
Dynamic pricing lets you adjust rates based on demand and market conditions, helping you capture more revenue during high demand periods while staying competitive during slower times.
Promoting direct bookings cuts out OTA commission fees (which can be 15-25%), effectively increasing your actual revenue per booking. Use your website, loyalty programs, and targeted marketing to drive these direct reservations.
Length-of-stay restrictions during busy periods reduce operational costs and turnover, maximizing revenue by encouraging longer stays when demand is high.
Upselling and Cross-selling Strategies
Encourage room upgrades and add-ons to boost average daily rates without extra marketing spend. Train your staff to spot upsell chances during bookings and check-ins.
Create packages combining rooms with spa treatments, dining, or local attractions to offer more value and justify higher rates. These often appeal to specific market segments and increase revenue per guest.
Use booking engines that promote add-ons like room service, parking, or Wi-Fi upgrades during the reservation process to capture extra revenue at the point of sale.
Cross-selling can extend beyond the initial booking, offering late checkouts, airport transfers, or concierge services that enhance guest experience and revenue.
Pricing and Inventory Management
Keep an eye on competitor pricing daily and adjust your rates to stay competitive while optimizing revenue. This helps you spot chances to raise rates or reposition yourself in the market.
Set minimum stay requirements during peak times and special events to reduce turnover costs and improve both occupancy and average rates.
Leverage predictive analytics to forecast demand 30-90 days ahead, allowing you to plan pricing strategies well before peak booking periods.
Offer differentiated room types with premium features to attract guests willing to pay more, while keeping base rates competitive for price-sensitive customers.
RevPAR Alternatives and Related Metrics
While RevPAR focuses on room revenue, other metrics give you a fuller picture by including additional revenue streams and operational costs. Using multiple metrics together helps you understand your property’s overall financial health.
These alternatives are especially useful for full-service hotels where rooms are just part of the revenue mix. Knowing when and how to use each metric helps you get a complete view of your hotel’s performance.
Revenue managers increasingly rely on these comprehensive metrics to see the real impact of their strategies beyond just room revenue.
TRevPAR (Total Revenue Per Available Room)
TRevPAR includes all hotel revenue—rooms, food and beverage, spa, and other services. It’s calculated as: Total Hotel Revenue ÷ Total Available Rooms.
This gives a broader look at revenue generation, valuable for luxury and full-service hotels with significant non-room income. TRevPAR helps you spot opportunities to boost total revenue through amenities and services.
Hotels with big conference centers, restaurants, or entertainment venues often find TRevPAR more reflective of actual business performance than RevPAR alone.
GOPPAR (Gross Operating Profit Per Available Room)
GOPPAR measures profit after operating expenses, offering a true look at profitability. It’s calculated as: Gross Operating Profit ÷ Total Available Rooms.
This metric accounts for costs like staffing, utilities, and maintenance, showing if RevPAR gains translate into real profits or just higher expenses.
Hotel managers use GOPPAR to balance cost control with revenue growth, ensuring profitability doesn’t get lost in the numbers.
ARPAR (Adjusted Revenue Per Available Room)
ARPAR adjusts for variable costs and extra revenue per occupied room, giving a net revenue view. The formula is: (ADR - Variable Costs + Additional Revenue) × Occupancy Rate.
It factors in costs like cleaning, utilities, and guest services while including ancillary income. ARPAR helps you understand the actual revenue generated after covering the direct costs of serving guests.
Revenue managers use ARPAR to evaluate which market segments and pricing strategies bring the most profitable business.
REVPOR (Revenue Per Occupied Room)
While RevPAR helps hotels understand revenue performance across all available rooms, it doesn’t always reflect the complete picture of guest spending. To gain a more detailed understanding of how much each occupied room contributes to total income, hotels should also analyze RevPOR — Revenue Per Occupied Room.
This metric focuses specifically on revenue generated from guests actually staying at the property, offering valuable insights into upselling success, ancillary income, and overall profitability.
Common RevPAR Calculation Mistakes to Avoid
Getting your RevPAR calculation right is key to meaningful insights. Here are some common pitfalls to watch out for:
Including taxes and fees in room revenue inflates your RevPAR and skews comparisons. Stick to base room rates and legitimate room-related revenue.
Mixing multiple properties in one calculation can distort results due to different markets and property types. Analyze each property separately for accuracy.
Leaving out additional room revenue like resort fees, Wi-Fi charges, or parking fees underestimates your actual revenue. Include these if they’re genuine room-related income.
Ignoring differences in room types and their revenue contributions can mislead you. Use weighted calculations if your property has varied room categories.
Overlooking seasonal patterns when comparing time periods can give a false picture. Use year-over-year comparisons and seasonal adjustments for better insights.
Using inconsistent time frames for tracking trends creates artificial ups and downs. Stick to consistent reporting periods for reliable analysis.
Understanding RevPAR inside and out empowers you to make smarter decisions that boost revenue and competitive edge. It’s the cornerstone of effective revenue management, helping you balance pricing, occupancy, and operations.
Improving your RevPAR takes ongoing attention to market trends, competitor moves, and operational efficiency. By following the strategies and avoiding common mistakes in this guide, you can steadily improve your hotel’s RevPAR and grow your revenue sustainably.
Start tracking your property’s RevPAR today using these formulas and benchmarking tips. Regular monitoring and smart adjustments will help you maximize revenue and keep your hotel thriving in a competitive hospitality landscape.