Revenue Generating Index (RGI): Understanding Hotel Performance
 Mika Takahashi
 Mika Takahashi
In the fast-paced world of hotel revenue management, few metrics are as crucial as the Revenue Generating Index (RGI). Think of it as your hotel's report card, showing how well you're doing compared to your direct competitors. For revenue managers, it’s an essential tool that offers clear insights into pricing strategies, market positioning, and overall financial health.
The revenue generating index has become a go-to key performance indicator for hotels aiming to boost their financial performance and stay ahead in their local market. Whether you're a seasoned pro or just starting to dive into hospitality analytics, knowing how to calculate hotel RGI index, interpret what it means, and use it to your advantage can make a real difference to your bottom line.
This guide will take you through everything you need to know about the revenue generating index rgi — from the basics of calculation to smart strategies for improvement. You’ll learn how to track your hotel’s performance against competitors, spot opportunities for growth, and implement proven tactics to increase your market share.

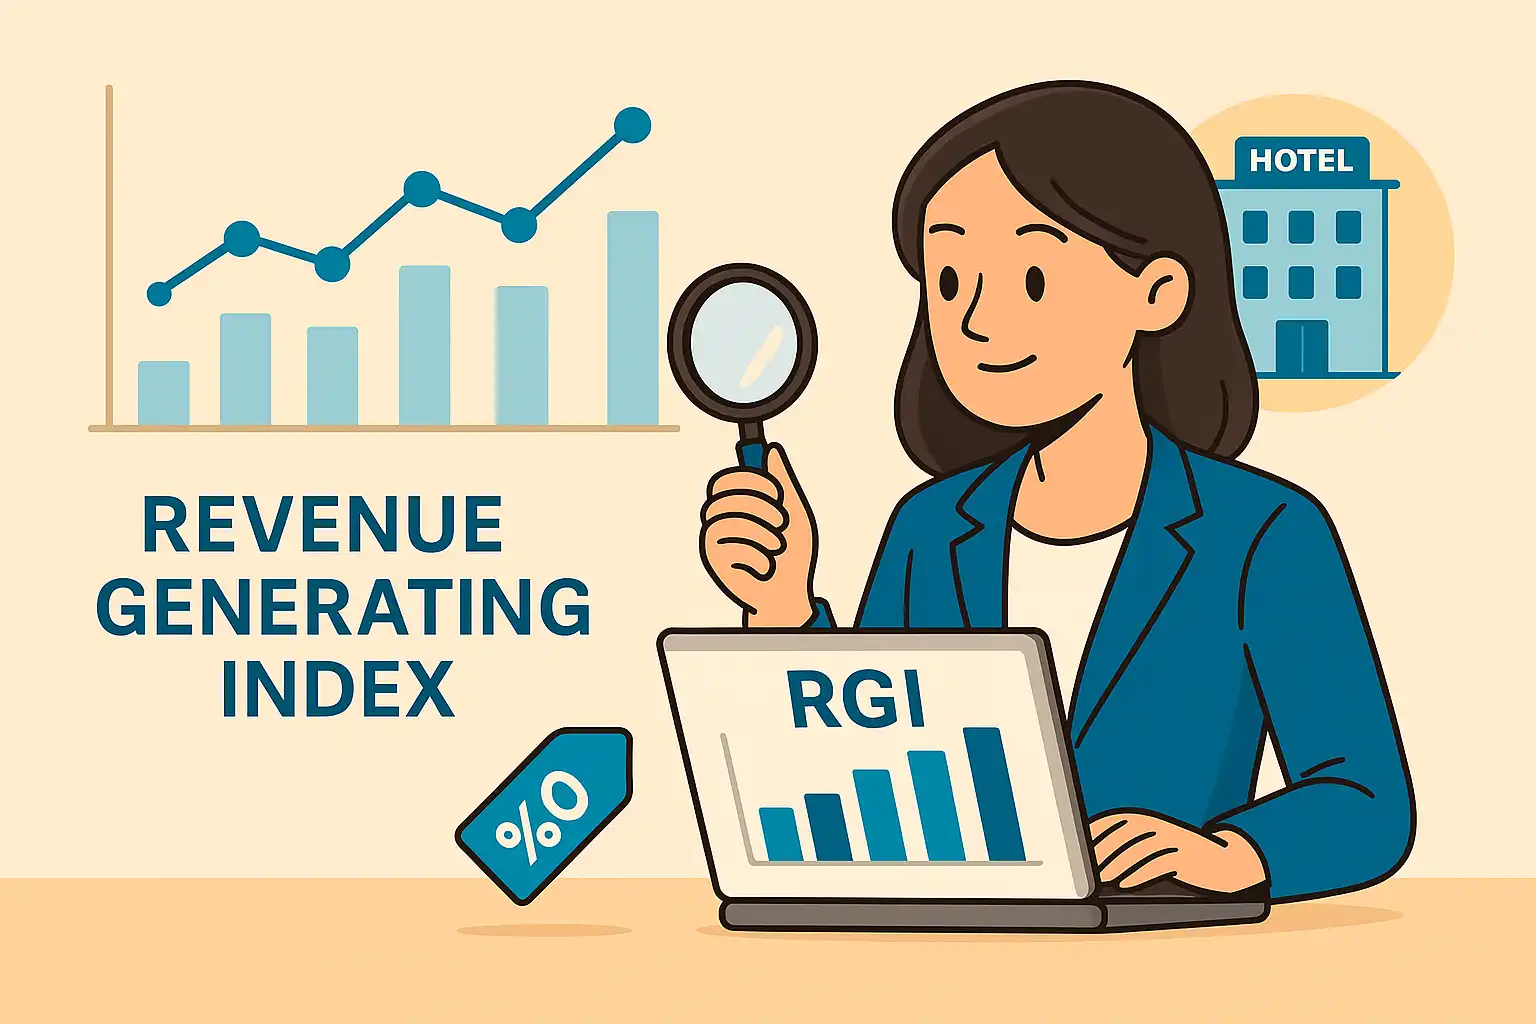
Simply put, the Revenue Generating Index is a benchmarking tool that compares your hotel’s RevPAR (Revenue per Available Room) to the average RevPAR of your hotel competitive set. This gives you a clear snapshot of how well your property is generating revenue compared to similar hotels in your area. It’s one of the most valuable metrics when it comes to making smart revenue management decisions.
The formula for RGI is straightforward:
RGI = Hotel’s RevPAR ÷ Competitive Set Average RevPAR
If your hotel’s RGI is exactly 1.0, you’re right on par with your competitors. An RGI above 1.0 means you’re outperforming the market, capturing more than your fair share of revenue. If it’s below 1.0, it’s a sign you might be missing out on potential earnings compared to your competition.
The idea of the revenue generating index actually comes from airline yield management back in the 1980s. Big hotel chains like Marriott picked it up in the 1990s, recognizing the need for smarter tools to measure revenue performance and fine-tune pricing strategies.
Today, revenue managers worldwide rely on hotel RGI as a quick, reliable way to gauge their market position and spot when adjustments are needed. It’s more than just a number — it influences everything from marketing efforts to long-term business intelligence.
Knowing your hotel’s RGI helps you make smarter choices about room rates, distribution channels, and how you stack up against the competition. It’s like an early warning system for losing market share and a confirmation when your revenue management strategies are working well.
Calculating RGI is pretty simple, but it’s important to do it right to get meaningful results. Here’s a step-by-step approach that revenue managers use to keep track of performance and make informed decisions.
Step 1: Choose Your Measurement Period
Decide whether you want to analyze your hotel RGI index monthly, quarterly, or annually. Monthly tracking helps you catch trends early, while quarterly reports smooth out seasonal ups and downs and give you a clearer picture over time.
Step 2: Calculate Your Hotel’s RevPAR
You can calculate RevPAR in two ways:
For instance, if your ADR is $200 and occupancy is 75%, your RevPAR is $150. Or, if you made $450,000 in room revenue with 3,000 available rooms, that also gives you $150 RevPAR.
Step 3: Get the Competitive Set’s Average RevPAR
Find the average RevPAR of your competitive set using STR reports, benchmarking tools, or other reliable industry data sources. Make sure you pick competitors that really match your market and guest profile for accurate comparison.
Step 4: Plug the Numbers into the RGI Formula
Let’s say your hotel’s RevPAR is $285 and your competitive set’s average is $267. Your hotel RGI index would be:
RGI = $285 ÷ $267 = 1.07
This means you’re performing 7% better than your competitors, generating more revenue per available room.
| Scenario | Hotel RevPAR | Compset’s RevPAR | RGI Result | Performance Level |
|---|---|---|---|---|
| Outperforming | $285 | $267 | 1.07 | 7% above market |
| At Market | $250 | $250 | 1.00 | Equal to market |
| Underperforming | $220 | $267 | 0.82 | 18% below market |
RevPAR combines two key factors: Average Daily Rate and occupancy. Understanding how these influence your hotel RGI helps you focus your improvement efforts.
The Average Daily Rate shows how much guests are willing to pay, reflecting your pricing power and the value your hotel offers. Hotels with higher ADRs often have better amenities, prime locations, or excellent guest satisfaction that justify those rates.
Occupancy rate reveals how well you fill your rooms, indicating demand and marketing effectiveness. For example, resorts might see big swings in occupancy between high and low seasons, which affects RevPAR.
Here’s a quick example: Hotel A has a $200 ADR and 75% occupancy, giving $150 RevPAR. Hotel B charges $180 but fills 85% of rooms, resulting in $153 RevPAR. Even with a lower rate, Hotel B’s strong occupancy boosts its revenue performance.
Some hotels focus on high occupancy with competitive pricing, others on premium rates with fewer guests. The best properties balance both to maximize revenue and improve their hotel RGI index.
Knowing what your hotel RGI means helps you make smarter strategic choices and benchmark your performance against industry standards.
An RGI between 1.00 and 1.05 means you’re doing well — capturing your fair share of market revenue and maybe a bit more. Hotels in this range usually have solid revenue management and competitive positioning.
If your RGI is above 1.10, you’re really excelling, outperforming competitors by a good margin. This often reflects strong pricing, excellent guest satisfaction, and effective market strategies.
On the flip side, an RGI between 0.90 and 0.99 suggests you’re slightly underperforming, losing some market share. It’s a signal to revisit your pricing, distribution, or guest experience.
An RGI below 0.85 is a red flag, indicating serious underperformance. This calls for urgent strategy changes to improve pricing, market positioning, or service quality.
Smith Travel Research data shows that top hotel chains usually maintain portfolio RGI averages above 1.05, while individual hotels should aim for consistent performance above 1.00 to stay competitive.
Remember, it’s more important to watch hotel RGI trends over time than to focus on single data points. Seasonal shifts, local events, and market changes can cause short-term fluctuations, so quarterly or annual reviews give a clearer picture.

Boosting your hotel’s RGI means focusing on the key drivers of revenue performance. Here are some tried-and-true tactics that can help you see measurable improvements within 6 to 12 months.
Using advanced revenue management systems like Prostay, IDeaS, or Duetto, lets you adjust prices in real-time based on demand, competitor rates, and market conditions. These platforms analyze tons of data points to help you price rooms optimally without losing your competitive edge.
Tools like Rate Gain or OTA Insight help you keep an eye on competitor pricing, so you can tweak your rates accordingly. During busy times, consider updating prices multiple times a day; slower periods may only need weekly adjustments.
Hotels that implement dynamic pricing often see RGI gains of 0.05 to 0.15 points in the first few months, with more growth as the system learns your market.
Keep track of how your pricing changes affect hotel RGI weekly, and train your revenue managers to use these insights wisely, balancing system recommendations with local knowledge.
Finding the right balance between direct bookings and third-party channels can significantly impact your net revenue and hotel RGI index.
Aim for about 40-50% direct bookings to save on commissions, while keeping a strong presence on OTAs like Booking.com and Expedia to maintain visibility.
Negotiate commissions aggressively with OTAs, leveraging your property’s performance to get better deals and promotional opportunities.
Make sure your website is mobile-friendly and easy to book from, and monitor rate parity across all channels to avoid penalties that could hurt your visibility.
Improving your distribution strategy can boost RGI in 3 to 6 months as you reduce commission costs and increase direct bookings.
Great guest service directly impacts your ADR and occupancy — the core of RevPAR and hotel RGI.
Invest in staff training focused on upselling and customer service to increase guest spending and encourage repeat visits.
Add amenities that guests value, like airport shuttles, spa packages, or complimentary breakfast upgrades, to justify higher rates and stand out from competitors.
Use guest feedback systems and respond quickly to online reviews to maintain a strong reputation that supports premium pricing.
Loyalty programs that encourage repeat bookings can reduce marketing costs and build a base of guests willing to pay for a trusted experience.
Seeing how RGI works in practice can help you understand its impact and how to improve it.
Example 1: Outperforming Property
A 200-room downtown hotel generates $750,000 monthly room revenue with 6,000 available rooms, resulting in a $125 RevPAR. The competitive set averages $110 RevPAR, giving an RGI of 1.14. This success comes from a great location, recent upgrades, and strong corporate rate deals.
Example 2: Equal Performance Property
A 150-room suburban hotel earns $375,000 monthly across 4,500 rooms, with an $83.33 RevPAR. The compset average is $83.50, so the RGI is 1.00. This hotel holds steady but lacks standout features to boost market share.
Example 3: Underperforming Property
A 100-room airport hotel brings in $180,000 monthly from 3,000 rooms, achieving $60 RevPAR. The compset average is $75, resulting in a 0.80 hotel RGI index. This indicates issues like dated facilities and poor online reviews that need urgent attention.
| Property Type | Monthly Revenue | Available Rooms | Hotel RevPAR | Compset RevPAR | RGI Score |
|---|---|---|---|---|---|
| Downtown Business | $750,000 | 6,000 | $125.00 | $110.00 | 1.14 |
| Suburban Hotel | $375,000 | 4,500 | $83.33 | $83.50 | 1.00 |
| Airport Hotel | $180,000 | 3,000 | $60.00 | $75.00 | 0.80 |
This 150-room hotel boosted its RGI from 0.88 to 1.12 over 18 months, a 27% improvement that added $2.3 million in annual revenue.
They implemented dynamic pricing software, renovated their lobby and meeting spaces, and invested in staff training to increase upselling and guest satisfaction.
Their ADR rose by 12% while occupancy stayed strong, and their RevPAR jumped from $105 to $142, outperforming their competitive set’s more modest growth.

Modern revenue management depends on technology that offers real-time hotel RGI insights, competitive benchmarking, and predictive analytics.
STR (Smith Travel Research) is the industry leader in benchmarking data, providing monthly hotel RGI reports for tens of thousands of hotels worldwide.
Platforms like HotStats go beyond room revenue, including total revenue and profit metrics to give a fuller financial picture.
Kalibri Labs offers advanced analytics and demand forecasting, helping revenue managers anticipate market shifts and adjust strategies proactively.
Revenue management systems like Prostay, IDeaS, Duetto, and RevPAR Guru integrate RGI tracking into their pricing platforms, typically costing $2-5 per room per month and requiring a month or two for setup and training.
Integrating your property management system with revenue management and hotel business intelligence tools ensures smooth data flow and automated RGI tracking.
Cloud-based analytics with mobile access let revenue managers monitor and adjust pricing on the go, crucial for staying competitive in a dynamic market.
While RGI is a powerful indicator, it’s important to understand its limits and use it alongside other metrics for a complete picture.
Choosing the right competitive set is critical — if you compare yourself to the wrong hotels, your RGI won’t reflect reality. Your compset should include 3-5 properties that truly compete for your guests.
The Market Penetration Index (MPI) looks at occupancy rates compared to competitors, showing how well you capture demand.
The Average Rate Index (ARI) focuses on pricing, comparing your ADR to the market average.
| Metric | Formula | What It Measures | Strategic Insight |
|---|---|---|---|
| RGI | Hotel RevPAR ÷ Compset RevPAR | Overall revenue performance | Total competitive position |
| MPI | Hotel Occupancy ÷ Compset Occupancy | Demand capture effectiveness | Market share strength |
| ARI | Hotel ADR ÷ Compset ADR | Pricing power | Rate positioning |
Sometimes RGI alone doesn’t tell the full story — for example, during renovations, market disruptions, or special events. Looking at trends and other metrics helps avoid misleading conclusions.
Also, a high RGI achieved by underpricing can hurt profits, so it’s important to balance revenue growth with profitability.
Focusing too much on short-term RGI gains might also compromise guest satisfaction or brand value. Sustainable success comes from balancing metrics with excellent service and long-term strategy.
Using RGI as part of a broader revenue management toolkit helps you get a well-rounded view of your hotel’s performance and identify the best opportunities for growth.
With consistent monitoring, smart interpretation, and integration into your revenue management practices, mastering RGI can give your property a lasting competitive advantage and stronger financial results.